The growing season is well underway in most crop-growing regions of Idaho. During this time of year, yield projections at the field and/or farm scale are common discussion items among members of the Idaho agricultural community. Within this context of forecasting crop yields, this article includes a description of the concept of “profitability mapping,” as well as an assessment of the applicability of utilizing profitability mapping as an information tool that can be used to guide Idaho farm management decisions, especially enhancing precision of input usage.


Profitability mapping overview
Many readers are likely familiar with the concept of yield mapping, which has been a practice adopted by U.S. farmers since the early 1990s. Just for clarity, yield mapping is an activity in which field-scale maps are created that include georeferenced data on yield and field characteristics, such as soil moisture, for each location on a field. These data are typically gathered by a harvesting combine or through georeferenced load or hand harvest data and then included in a geographic information system (GIS) software program to create a map. Such yield maps, especially after at least five years of consecutive maps are created, can be useful for determining the extent of spatial productivity variability that exists in a field. If one portion of a field is consistently underperforming relative to other parts of a field over several years, then it may likely be worth investigating why the productivity is different. Supplemental spatial field data such as georeferenced soil samples can be helpful for characterizing productivity issues. If an issue is identified and information regarding its potential source is available, then it is worth assessing whether the current management strategy should be adjusted for the portion of the field that has an issue.
The concept of profitability mapping is an extension on yield mapping in which, in addition to yield, information on inputs applied, input costs and sales prices are all encompassed into a map. In contrast to yield maps for which the measure for each field portion is a volume per area unit (e.g., bushels per acre), profitability maps ascribe dollar amounts for each part of a field. Profitability maps can be helpful for determining the relative extent to which different areas in a field are profitable or not, which can provide insights regarding whether there are any actions that can be taken to increase profitability in lagging areas.
Example case study for southern Idaho
With the concept of profitability mapping in mind, we next present a case study for a southern Idaho field to help determine situations and scenarios in which usage of profitability mapping may or may not be useful.
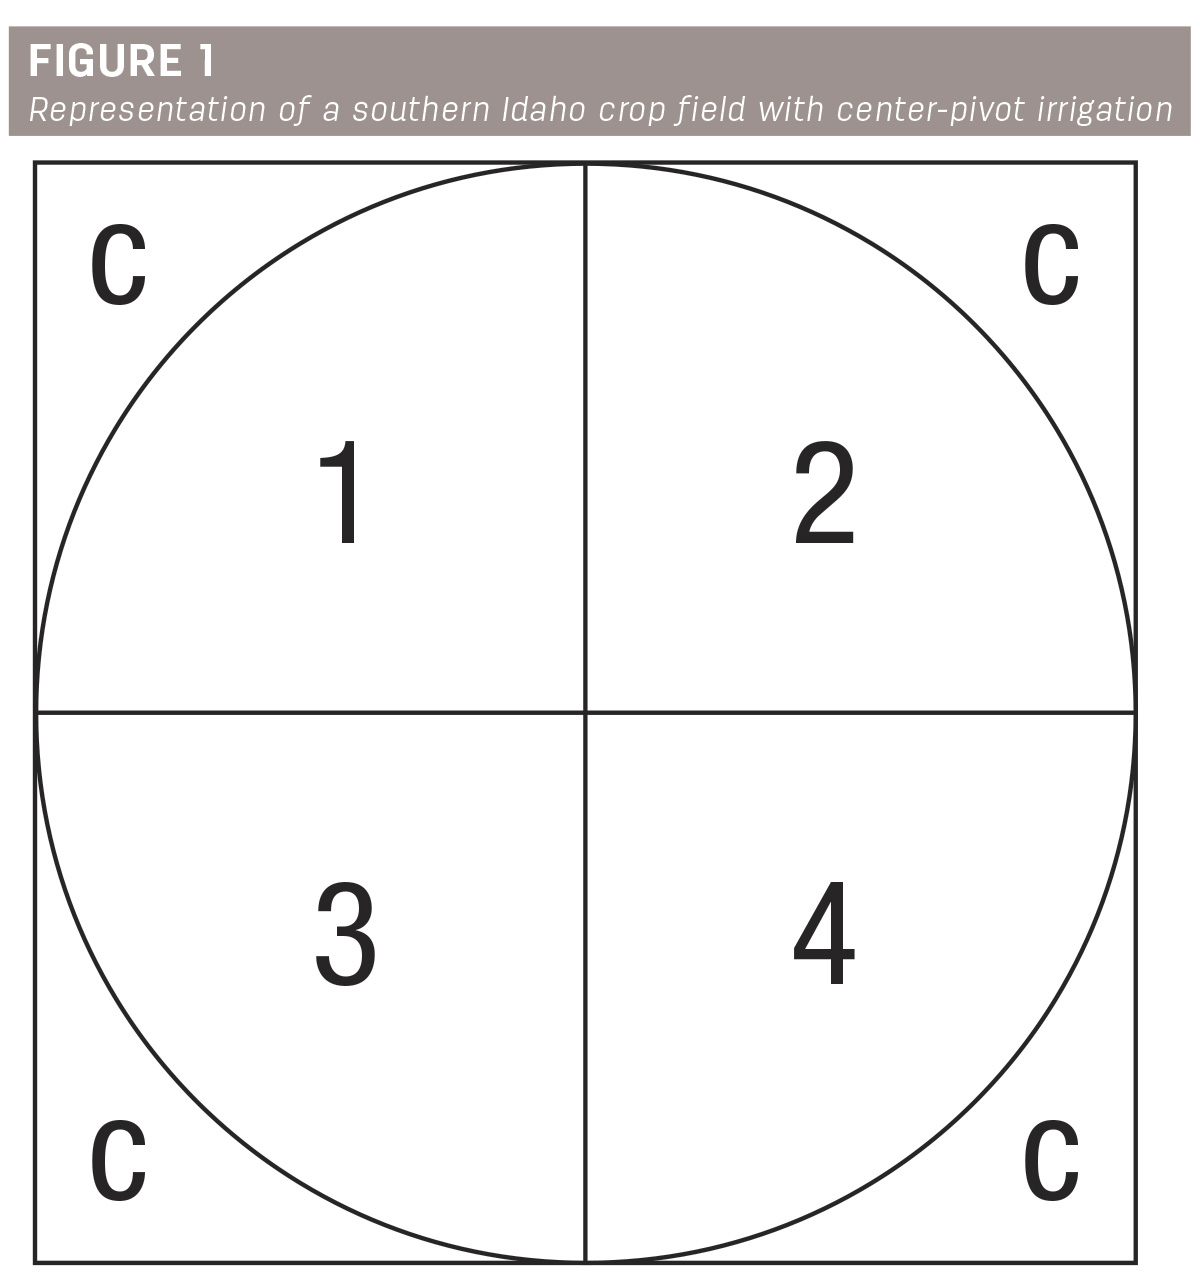
Figure 1 is a representation of a southern Idaho crop field that is under center-pivot irrigation, and that is divided into four portions. The “C's” in the corners are the corner portions that are neither planted with crops nor irrigated. Suppose that this field has been yield mapped for the past 12 years and has a four-year crop rotation of barley, potatoes, wheat and sugarbeets. In such a case, there are three years of yield maps for each crop.
Suppose next that the yield map data for this field are averaged for each portion of the field for each of the 12 years. Upon examination of these historical data, it quickly becomes clear that field portion 4 was dramatically and consistently underperforming relative to the other field portions.
To determine the extent to which field portion 4 underperformed compared to the other portions, the average yields for field portion 4 were compared to the averages of the other three portions. The results from these calculations are included in Table 1. It is observed that field portion 4 consistently underperformed the other field portions regarding yields, but to varying degrees across crops. The relative underperformance ranged from 15% lower for wheat to 30% lower for potatoes.

While it appears clear that field portion 4 has an issue with productivity, a profitability map may help to discern whether, and the extent to which, production practices may be adjusted to improve profitability. Since production costs vary considerably across crops – with those for barley and wheat ranging from around $400-$600 per acre, those for sugarbeets near or over $1,000 per acre and those for potatoes near or over $3,000 per acre – the decision to change production practices will have varying profitability implications across the rotation years. However, given the relatively high cost of production for sugarbeets and potatoes compared to barley and wheat, profitability maps can be particularly helpful during years in which relatively high-cost crops are planted. Sales prices also matter such that it may be possible to remain profitable without adjustments to production practices in relatively high sales price years.
There are two main takeaway messages from this article. First, gathering georeferenced data on field characteristics (e.g., soil samples) and yields can provide useful information for determining whether profitability can be enhanced in some field portions with some adjustments to current production practices. Second, the relative value of such information varies across crops that are grown in southern Idaho, with their value being higher for potatoes and sugarbeets, which have relatively higher input needs and costs than other crops. However, gathering data on all crops in a rotation is essential for determining whether a productivity issue that is identified in a field is generalizable across all rotation crops or just specific to one type of crop.
References omitted but are available upon request by sending an email to the editor.