U.S. dairy farmers produced about 200 billion pounds of milk in 2012.

The Dairy Products Annual Summary, compiled by the National Agricultural Statistics Service (NASS), reports the milk was manufactured into 10.9 billion pounds of cheese, churned into 1.9 billion pounds of butter, dried into 2.3 billion pounds of various milk powders, frozen into seven billion pounds of ice cream and other frozen products, and processed into almost 55 billion pounds of fluid milk.
As seen in Table 1 , production of some dairy products is up significantly from 10 years ago, some products have declined, and some remained steady.
Yogurt and cheese production is up 76 percent and 27 percent, respectively.
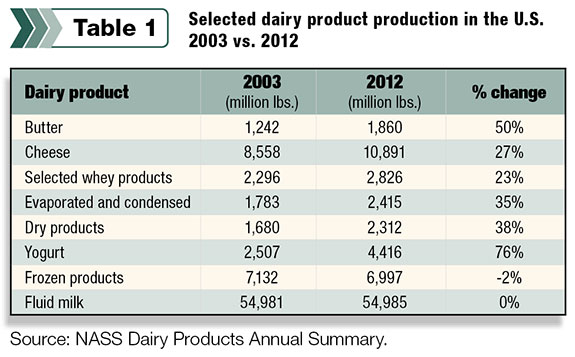
From 2003 to 2012, butter production went up 50 percent, and production of dry products such as nonfat dry milk increased 38 percent, while the production of frozen products (ice cream) and fluid milk shows little change over the 10-year period.
A closer look at the statistics shows Italian-style cheese was the number one cheese produced in 2012, accounting for 42.5 percent of total cheese production.
American cheese was second, representing 40 percent of total cheese production. Ten years ago, American cheese was first and Italian second.
Only looking at dairy product production by total pounds of finished product does not give us a complete picture of how the nation’s milk production is utilized.
For example, it takes about 10 pounds of milk to produce 1 pound of cheese, while a gallon of raw milk will produce a little less than one gallon of processed 2 percent fluid milk. Butter contains about 80 percent butterfat but little nonfat solids.
On the other hand, nonfat dry milk is almost all nonfat solids with just a fraction of butterfat. Production of the fast-growing Greek-style yogurt takes two to three times the amount of milk to produce compared to traditional yogurt.
Looking at production of dairy products based on how much butterfat and nonfat solids each product uses is a better indicator of how the nation’s milk production is utilized.
Butterfat
The 200 billion pounds of milk produced by dairy farmers in 2012 contained about 7.5 billion pounds of butterfat.
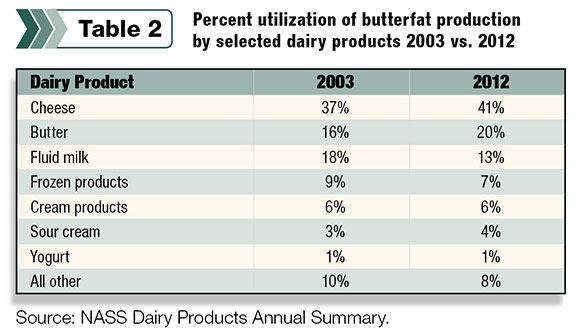
As seen in Table 2 , 41 percent of the butterfat ended up in cheese, followed by butter utilizing 20 percent, and fluid milk used 13 percent of butterfat production.
These three products utilized almost 75 percent of the nation’s butterfat production in 2012.
Less butterfat used in frozen products, mainly ice cream, in 2013 compared to 2003 is due to consumers purchasing more low-fat ice cream compared to regular ice cream.
Production of regular ice cream declined 12 percent during the past 10 years, while production of low-fat ice cream increased more than 30 percent during the same period.
Nonfat solids
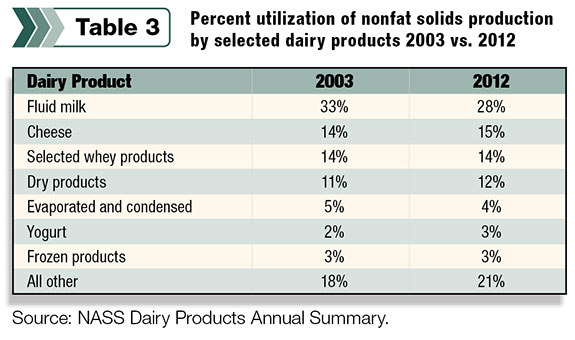
Even though total fluid milk sales have remained flat, fluid milk is still the leading use of nonfat milk solids (as seen in Table 3 ), using 28 percent of the nation’s nonfat solids production.
Second in usage was cheese followed by its byproduct, whey.
Total solids
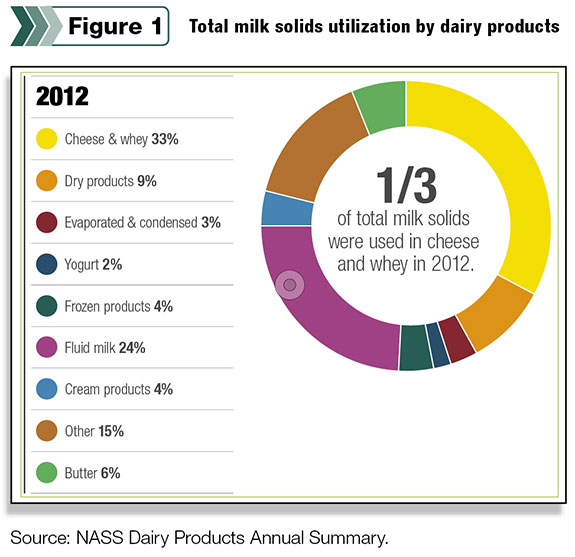
Combining butterfat and nonfat milk solids together into total solids provides us an even better overall perspective of how the nation’s milk supply is used. See Figure 1 .
About one-third of the total milk solids were used in cheese and whey in 2012.
Fluid milk was second in utilization of total solids last year at 24 percent. Ten years ago fluid milk used almost 30 percent of total solids.
Frozen products, which include ice cream, used 4 percent of the nation’s milk solids in both 2003 and 2012.
For the past few years, the yogurt industry has received much attention due to its sales growth.
Granted, yogurt production increased an impressive 76 percent from 2003 to 2012; however, yogurt still only utilized 2 percent of the total solids produced by the nation’s dairy farmers.
What do these numbers mean? Let me share three observations.
First, the U.S. has a viable, dynamic and growing dairy processing and manufacturing industry. U.S. dairy farmers increased milk production by 30 billion pounds in just 10 years. The processing and manufacturing capacity was available to handle the growth in milk production.
In fact, the number of plants manufacturing one or more dairy products increased from 1,126 to 1,288 dairy manufacturing plants in 2013.
If milk production expands another 30 billion pounds during the next 10 years, the industry must make the investment needed to ensure plant capacity is available to efficiently process and manufacture the nation’s milk production into marketable dairy products.
Second, the U.S. dairy industry is diverse in regard to products produced. No one dairy product utilizes the majority of milk production. It is good for the industry, and the nation’s dairy farmers, not to have all of its eggs in one basket.
Third, consumers continue to “eat” more of their dairy products than “drink” their dairy products. In 2003, about 70 percent of total milk solids were utilized in manufactured dairy products (cheese, butter, powder, etc.) and 30 percent in fluid milk.
Last year, manufactured dairy products used about 76 percent of total milk solids compared to 24 percent in fluid milk. All indications point to that trend continuing. PD
Calvin Covington is a retired dairy cooperative CEO and now does some farming, consulting, writing, and public speaking.
Photo by ThinkStock.

Calvin Covington
Retired Dairy Co-op Executive