The spring of 2012 started out early in the Midwest U.S., with warm temperatures in March and into April, but then quickly cooled off. Late-season frost events left us questioning whether the alfalfa crop could survive spring. The crop survived and we transitioned into a drought among the most severe the U.S. has seen in decades, stressing most crops and regions – and yielding some very different and interesting forage results.
Forage yields are mostly down throughout the Midwest compared to 2011, hurting inventories and the economics of feeding our herds. However, as we progress to the end of the 2012 feed harvest, forage quality is coming out strikingly different compared to 2011.
In my new role with Rock River Lab, I’ve had the opportunity to summarize thousands of forage samples from across the U.S. Using database averages, we can model how this year’s forage will work in our nutrition programs.
On that note, let’s look at this year’s corn silage and haylage milk potential relative to last year’s. In Table 1 we’ve listed selected nutrient or digestion averages for corn silage (CS) and alfalfa haylage (Hlg). (Click here or on the image at right to view it at full size in a new window.)
The samples are from August through September of 2011, as well as for 2012. For fiber (NDF) digestibilities, rather than using a number, we’ll focus on the difference between one sample (year in this case) and another. This is an important point because in vitro NDFD values are not the same across labs; however, the differences between samples or a sample and the average reported by lab are meaningful.
So again, rather than use a single number (e.g. 45 percent), we’ll focus on the difference. The same concept applies to the fiber digestion rate (C3 Kd).
The results show that the 2012 drought in the Midwest has driven down starch levels and increased NDF levels in corn silages, which will decrease energy content. Contrasting though, NDF digestibility has increased because of drought stress and weaker plants, which will increase energy content.
So to evaluate the impact this silage will have on milk, we measured the lower starch and higher NDFD corn silage with two model dairy diets.
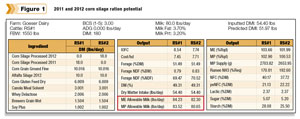
Using a CNCPS v6.1 nutrition model, we entered the forage results into a ration balanced for about 80 pounds of milk. In comparing the two rations we kept most nutrients the same but updated those listed in Table 1. We used moderate amounts of corn silage (18 lbs dry matter for a higher corn silage diet) and then swapped in and out the 2011 and 2012 silages.
What happened? The 2012 silage resulted in roughly two to three lbs less milk (See Figure 1) . The lower-starch and higher-NDFD silage has less energy overall than the 2011 silage. ( Click here or on the image at right to view it at full size in a new window.)
Obviously no two diets are the same and your forage results may differ.
However, this example gives us a rough estimation of this year’s crop quality and we will likely need to offset lower starch levels despite the higher fiber digestibility in 2012 silage.
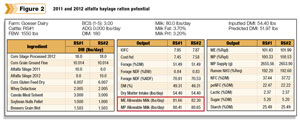
This year’s haylage, however, has had an opposite effect on milk. Alfalfa NDFDs are higher in 2012 and dairies are seeing that response as milk in the bulk tank. To forecast the impact haylage will have as we head into 2013, we used a similar approach to that for corn silage crops.
We compared 2011 and 2012 haylage crops using the database averages for alfalfa haylage from Table 1.
With similar diets to that described above with 10 lbs dry matter of alfalfa silage, we’re now showing an increase in milk (See Figure 2). ( Click here or on the image at right to view it at full size in a new window.)
If you are feeding more haylage or your NDFDs are higher, your production will be higher in the Midwest. The West 
Coast is seeing similar gains in NDFD – not only for alfalfa but also corn silage (Table 2) . ( Click here or on the image at right to view it at full size in a new window.)
For both California’s 2012 corn silage and alfalfa crops (Leg. for both haylages and hay), nutrient contents are similar to 2011 and NDFDs are higher on average.
Higher NDFD means being able to feed more forage and more milk in the tank or higher gains. We modeled a ration with the 2012 corn silage (not shown) and predicted about two lbs more milk. The 2012 alfalfa hay/haylage ration (not shown) predicted a slight increase as well.
All things considered, the 2012 average alfalfa crop has slightly more energy than 2011. This means producers across the U.S. can feed higher levels and produce similar milk or gains.
Corn silage in the Midwest looks to be slightly lower in energy because of the drought impact on grain levels; nutritionists will need to increase energy density with sugars or more starch. Western producers, however, will be able to feed more corn silage because of higher NDFDs and be capable of more milk this year. PD
References omitted due to space but are available upon request. Click here to email an editor.

-
Dr. John Goeser
- Directory of Nutritional Research and Innovation
- Rock River Laboratory, Inc.


