Monthly test-day somatic cell count (SCC) reports from the Dairy Herd Improvement system have been used for decades to manage bulk tank SCC or decide which cows to cull from the herd.

More recently, on-farm precision technologies provide dairy producers and veterinarians the opportunity to collect SCC values for each cow at every milking.
Failure to recognize the day-to-day variability in individual cow SCC can result in misinterpretation of both reports, according to Dr. David Kelton, veterinary epidemiologist and professor at the University of Guelph.
Kelton presented “High SCC is always problematic (or is it?)” at the American Association of Bovine Practitioners 50th Annual Conference, Sept. 14-16, 2017, in Omaha, Nebraska.
Daily volatility in SCC
There is more daily volatility in cow SCC than many people in the dairy industry have traditionally considered. An example of daily SCC data from one cow over a four-month period is presented in Figure 1.
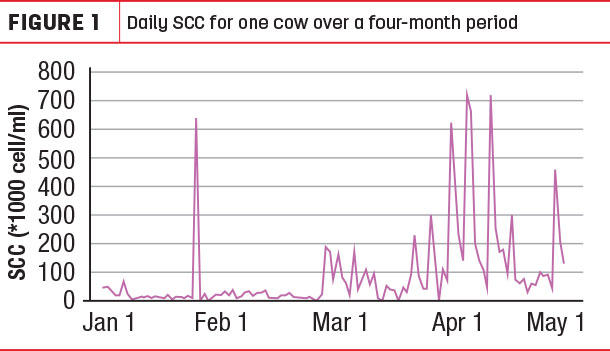
From a baseline of fewer than 40,000 cells per milliliter, there is a short spike in cow composite SCC to over 600,000 cells per milliliter at the end of January. Within two days, the cell count is back to fewer than 40,000 cells per milliliter, remaining at that level for the next month.
Kelton said there are at least three potential explanations for this type of SCC spike:
- An error in animal identification either at the farm or the milk-testing laboratory.
- Carryover of milk with a high SCC content from a cow milked prior to this cow using the same milking unit.
- A challenge to the mammary gland of this cow, during which bacteria was introduced into the udder during or after milking, producing an influx of leukocytes to clear the gland. With the challenge resolved, an intramammary infection (IMI) was not established, and the SCC returned to the baseline.
With no culture data to either support or refute any of these interpretations, the observer is left to wonder what’s occurring, Kelton said. If one accepts the third possibility, then this short spike is a clear example of a cow’s immune system responding to a mastitis challenge normally.
While worth noting, it’s not necessary to overreact. As long as the cow’s SCC comes back down to normal, these occurrences can be dismissed, Kelton said.
Figure 1 further shows the cow experienced a small rise in SCC at the end of February, followed by almost one month of SCC fluctuations between 50,000 cells per milliliter and 180,000 cells per milliliter.
It is likely there was some repeated challenge, and perhaps infection becoming established in one or more quarters, yet at no time during that month does the SCC rise above 200,000 cells per milliliter. This cow would not be classified as having an IMI.
However, by the end of March and through most of April, the SCC fluctuates quite dramatically between 50,000 cells per milliliter to over 700,000 cells per milliliter, an indication an infection is present.
Managing through SCC spikes
Producers who overreact to a daily spike might pull a high-SCC cow out of the pen or herd to lower the average bulk tank SCC but then be surprised when the bulk tank SCC is exactly the same at the next milk pick-up. Kelton described this as playing a game of Whack-A-Mole.
One cow spikes and is “whacked” by being pulled out of the herd, but the next day another cow is spiking in its place. Knowing this pattern and how individual instances occur in a lot of different cows suggests following this approach will not always be fruitful.
Daily SCC volatility also impacts monthly Dairy Herd Improvement system reports. Not only can a lot of things happen in the monthlong interval between tests but, depending on which day the fluctuation occurs, using the test-day results to classify cows as infected or not generates a substantial number of false positives and false negatives, Kelton said.
Figures 2 and 3 represent two different scenarios in which a traditional monthly test interval of 35 days is imposed over daily SCC data. Each black dot represents the monthly SCC test, and the horizontal line represents the cut-point for 200,000 cells per milliliter used to classify the cow as infected or uninfected with an IMI.
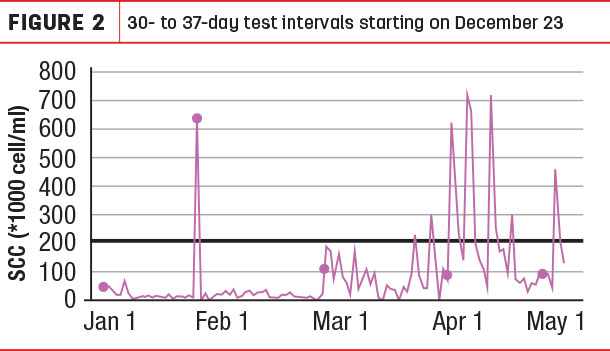
In Figure 2, the cow would have been classified as having a new infection at the second test in late January, then a cure at the third test in late February and uninfected at the fourth and fifth tests.
This is likely the worst scenario, as the “new infection” at the second test is likely a false positive, and the failure to detect the developing subclinical IMI at the third, fourth and fifth tests are potentially costly false negatives.
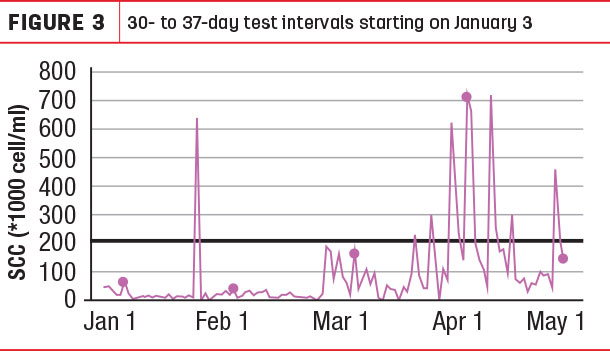
However, if the initial test day is shifted by 12 days (as in Figure 3), a different story develops. In this example, the cow is considered uninfected at the first three tests, classified as having a new infection at the fourth test and then cured at the fifth test.
Missing the short spike in late January is likely not a problem, but the use of the 200,000 cells per milliliter cut-point for defining an IMI resulted in a one-month delay in identifying a new infection.
Producers should not throw out what they are doing with monthly SCC tests, Kelton emphasized. Instead, they should understand there are underlying patterns going on that aren’t always seen. ![]()
ILLUSTRATIONS: Illustration by Getty Images.

-
Audrey Schmitz
- Editor
- Progressive Dairyman
- Email Audrey Schmitz