The Federal Milk Marketing Order (FMMO) administrators publish their data in a consistent format and with standardized definitions and data collection methodologies. Together, the 10 federal orders represent more than 60 percent of the U.S. milk produced.
This macro-data allows a good comparison of trends in milk produced and how the nature and use of this milk has changed. For this article, most of the comparisons are between 2013 and 10 years prior, 2003. The year 2013 is a good year to review because there was minimal de-pooling that can distort the FMMO data. Consistently positive producer price differentials discourage de-pooling.
During this time, some orders have grown, and some have not. Some have significantly changed the nature of their milk usage, and others have been static. All have reduced the number of herds. Less butterfat is being used in drinking milk, and more is being used in cheese-making.
Most of the trends have been consistent over the last 10 years and can therefore be expected to continue. In a sense, a review of the last decade can provide a window of where the next decade may be going.
The comparative data includes the four federal orders paid on the advanced system and the six federal orders paid on the component system. A map of these orders is shown in Figure 1 . The six orders paid on the component system are the Northeast, Central, Upper Midwest, Mideast, Southwest and Pacific Northwest.
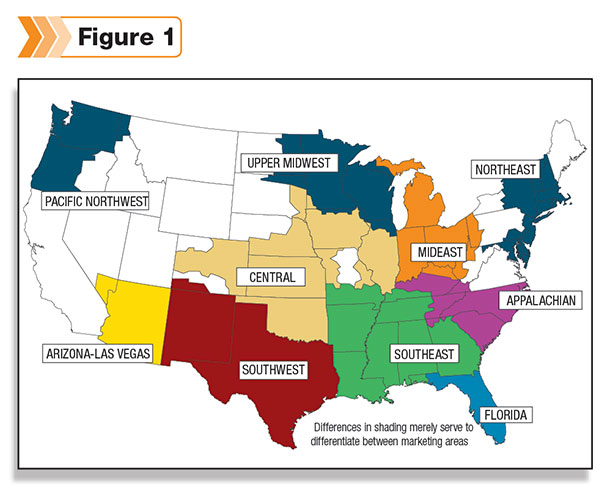
The four orders paid on the advanced system are Florida, Southeast, Appalachian and Arizona – Las Vegas. The six paid on the component system produce primarily Class III milk for cheese production. Three of the orders paid on the advanced system produce primarily Class I beverage milk.
The fourth order paid on the advanced system, Arizona – Las Vegas, is an exception because it produces a lot of nonfat dry milk for export as well as Class I beverage milk.
Tables 1 and 2 illustrate the difference in production between the classes of milk and the individual orders. The extremes are the Upper Midwest, where 86 percent of the milk went to cheese, and Florida, where 86 percent of the milk went to beverage products.
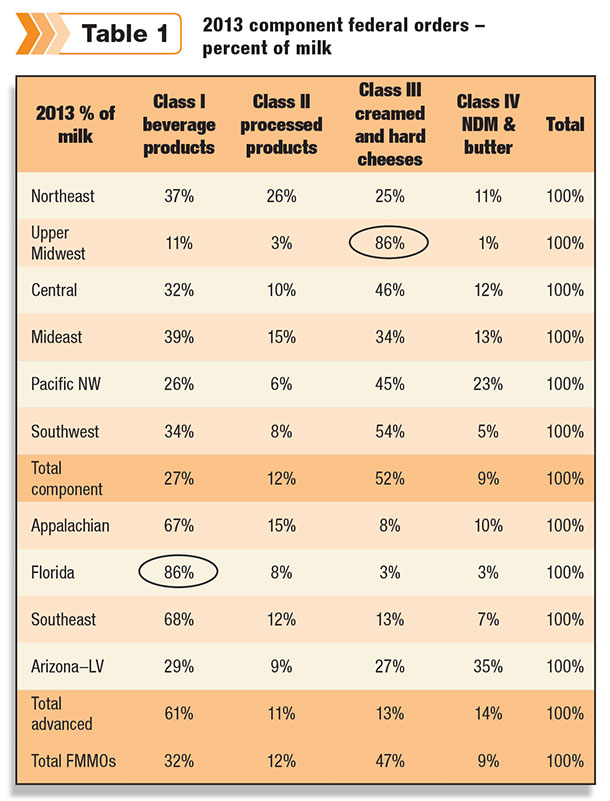
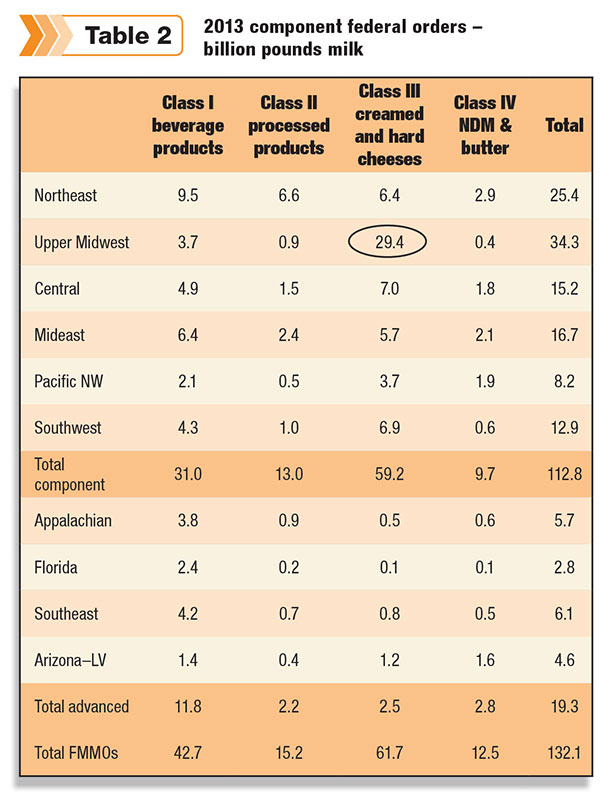
The Upper Midwest is the largest FMMO, and Florida is the smallest. This size difference illustrates the growing market for cheese versus beverage milk. Because Class I milk is the highest paid, the Florida order has the highest-paid milk.
In 2003, the large Upper Midwest order had only 63 percent of its milk going to cheese compared to 86 percent in 2013. The Upper Midwest milk Classes I, II & IV have decreased only slightly in volume. The significant volume growth in Class III milk has grown the Upper Midwest order and has drastically increased the percentage of milk going to cheese.
The growth in cheese production, and therefore the milk for cheese production in the Upper Midwest, has been the biggest change in the entire FMMO system. Consumer trends indicate that Class III milk for cheese will continue to grow.
The material changes over the last decade are really all about cheese. From 2003 to 2013, milk receipts increased by 26 billion pounds in the FMMOs. Increased receipts for Class III milk accounted for 25 billion pounds of that increase.
The Upper Midwest took the majority of the new cheese business with an increase of 19 billion pounds of Class III milk. The total pounds of Class III milk in the Upper Midwest, 29.4 billion pounds, far outweigh any other class in any other order. The Southwest increased Class III milk by 5 billion pounds with the addition of a major new cheese plant.
The Class IV – NDM in the Arizona – Las Vegas order has also seen significant growth, increasing by 221 percent between 2003 and 2013. Class IV now represents 35 percent of their milk, up from 24 percent in 2003. Most of this is being exported.
In terms of milk volume, if we turned back the calendar by one decade, the four federal orders paid on the advanced system would not look much different. They produced 19.3 billion pounds of milk in 2003, and they produced 19.3 billion pounds in 2013.
Class I milk dropped slightly from 65 percent to 61 percent of the total milk volume in the advanced payment orders. The only large change occurred in the Arizona – Las Vegas order with the Class IV – NDM growth. This was offset by decreases in beverage milk and cheese production in the other advanced payment orders.
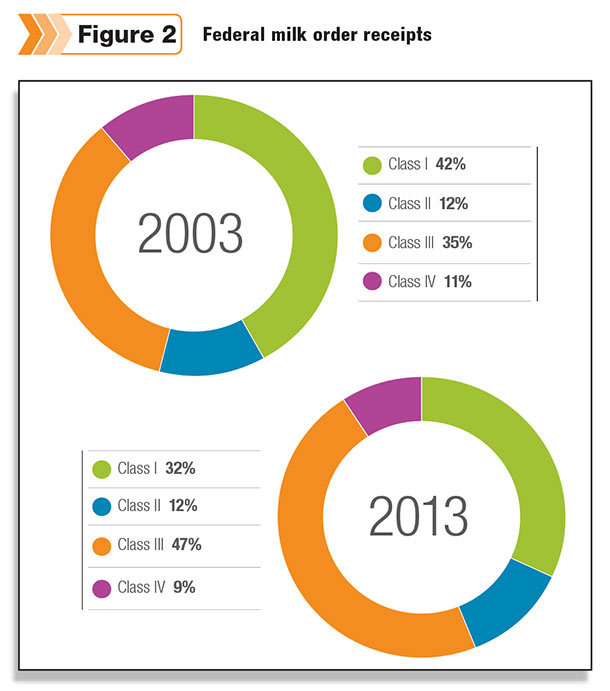
Overall, these changes have significantly changed the landscape of milk usage from 2003 to 2013. Class III milk for cheese is now the largest category and still growing. Class I beverage milk continues to shrink. These trends can be expected to continue in the next decade.
In addition to shrinking in liquid volume, Class I milk is also consuming less butterfat. In 2003, Class I averaged 2.0 percent butterfat. In 2013, it averaged 1.87 percent butterfat.
This is reflected in the long-term trends from whole milk to 2 percent milk, which is now the largest seller, to a projected shift to 1 percent milk becoming the largest seller in the next decade. Consumers are becoming more conscious of fat in their diets when drinking milk. This is not the case when they are eating cheese.
The level of butterfat in the current largest category, Class III, has remained near full fat levels. In 2003, Class III milk used 3.73 percent butterfat, and in 2013 the butterfat level was 3.82 percent. There are no noticeable long-term trends.
Lower-fat cheese has not achieved much market share, and there are no trends to lower fat in cheese to date. However, there is considerable research to develop cheese with the same great taste and mouth feel with lower fat (and salt). If a consumer trend developed toward lower-fat cheese, this could really change the landscape for butterfat demand.
The dairy growth markets of yogurt and nonfat dry milk have not shown much impact on the Class II and Class IV categories in the FMMOs. Yogurt (Class II milk) is a growing category but still a relatively small category, and at least one major new yogurt plant was built outside of the FMMOs and would therefore not be included in the FMMO database.
The significant growth of NDM for the export market has somewhat impacted the West Coast Arizona – Las Vegas and the Pacific Northwest orders, but this NDM export market has been largely dominated by the California dairy operations that are not in the federal order system.
Growth in component levels
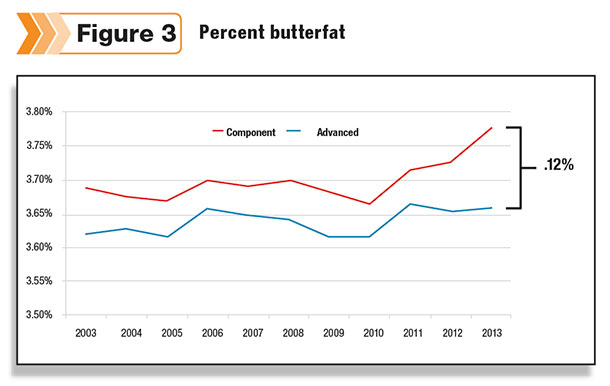
Everyone who sells milk in the FMMO gets paid for butterfat content. It would, therefore, seem that they are all equally incentivized to increase butterfat levels. However, by 2013, those paid on the advanced system reported butterfat levels at 3.66 percent, while those paid on the component system reported a 3.78 percent butterfat level.
The component orders have always maintained a higher butterfat level for some understandable reasons like latitude and temperature. But in the last few years, this difference has spread from about a half percentage point difference to a full percentage point difference.
The difference may be that butterfat levels are also typically tied to protein levels. Those in the component-paid systems receive payment for protein increases as well as butterfat increases, and the price for milk protein is about twice that of butterfat. Additionally, many are also paid additionally for higher protein levels needed by the cheese manufacturers.
Many producers in the component-paid milk orders can get a nice return on investment when implementing practices like amino-acid balancing that typically do increase feed costs but will increase butterfat and protein levels. The returns for those paid only for butterfat are significantly less.
Somatic cell count (SCC )
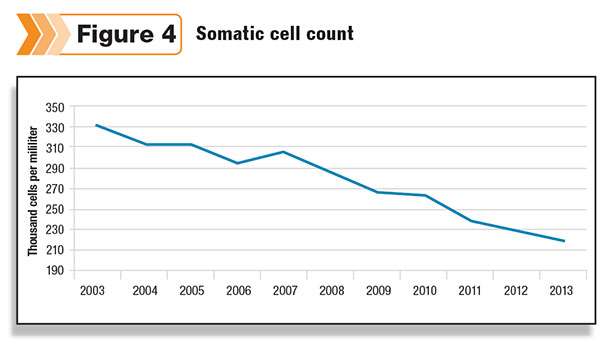
Producers in the four central U.S. FMMOs receive an incentive payment for a lower somatic cell count. That incentive is positive for a SCC below 350,000 cells per milliliter and negative above that. The SCC has been steadily declining and continues to do so.
Because this data is collected for reasons of payment, it is accurate and a good barometer of the entire U.S. dairy industry. With the current rate of descent, SCC should be below 200,000 on the average within two years. This is a terrific achievement.
There is a milk rejection standard of 750,000 cells per milliliter. In the international markets, competitors can use this maximum limit as a negative point for U.S. milk as most use the EU maximum of 400,000 cells per milliliter.
The 400,000-cell standard is enforced differently, but numbers are numbers. There is international effort to standardize this worldwide. To compete in the increasingly important global arena, the U.S. needs to comply with global standards.
Number of producers
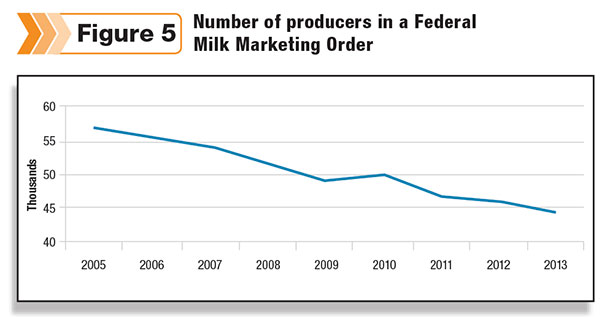
The number of producers decline each year. It is a linear decline. Could the dairy industry be going in the direction of the poultry industry? Will the “milk-producing” industry eventually consist of 20 very large publicly held companies?
The growth categories of cheese, nonfat dry milk and yogurt require milk components, not water. Will producers become more vertically integrated and immediately remove at least part of the water for ease of shipping and processing the milk? If that did happen, it could also drastically change the logistics of the dairy industry.
Things are always changing in the business world, and the winners typically lead the change and the others are forced to finally accept the changes. Changes often negatively impact short-term profitability but allow for long-term advantages. Finding the right long-term strategies is paramount to success. Looking at historical trends can help. PD
John Geuss is an independent dairy consultant. He can be reached by email .

John Geuss
Independent Dairy Consultant

