States with the largest increases in all cattle and calves include Texas (+500,000 head), Oklahoma (+200,000 head) and Idaho (+80,000 head). This marks the fifth year of expansion but at a slower rate than last year.
The expansion began with a combination of strong cow-calf operator returns in 2014 and 2015 as well as good pasture and range conditions in much of the Plains region. However, in recent years, dry conditions have plagued much of the region. Producers have seen feeder calf prices fall from the record levels of 2014-15 and hay prices climb during 2018. Hay stocks on Dec. 1, 2018, were the smallest since 2012, potentially adding to producer costs.
On Jan. 1, total cow inventory was estimated at 0.5 percent above a year ago at 41.1 million cows. However, a number of indicators point toward an even lower rate of expansion in 2019. Heifers for beef and milk cow replacement are often used as barometers of herd expansion or contraction rates. Compared to last year, cow-calf producers are indicating their intentions to retain 3 percent fewer beef heifers. As a percentage of the beef cow herd, this is a smaller number of replacements being held than last year.
Of those replacement heifers, the number expected to calve during the year is 5.8 percent below a year ago. This may also suggest producers may not be as committed to expanding their herds. Heifers for milk cow replacement show similar patterns, registering at 1.4 percent below 2018 levels, largely reflecting poor returns in the dairy sector.
Cow slaughter partly offsets lower fed cattle slaughter in 2019
According to the Feb. 27 NASS Livestock Slaughter report, 2018 commercial beef production is estimated at 26.9 billion pounds, 2.6 percent above 2017. The number of cattle slaughtered was 2.5 percent above 2017 levels at 33 million head. Despite only one more slaughter weekday in 2018 than in 2017, 2018 averaged 5,000 head more per slaughter weekday than in 2017.
The beef production forecast for 2019 was reduced by 310 million pounds from the previous month’s forecast to 27.3 billion pounds. This reduction is based on fewer-than-expected cattle placed in December 2018 and fewer anticipated placements in first-half 2019.
Winter weather across cattle feeding regions likely led to deteriorated pen conditions, limiting placements. As a result, the anticipated fed cattle slaughter for 2019 was reduced. Based on the USDA Agricultural Marketing Service weekly slaughter reports, the winter weather likely contributed to lighter carcass weights of fed cattle.
For the week ending Feb. 23, carcass weights for steers and heifers were 9 pounds and 10 pounds below the same week a year ago. Further contributing to lower overall carcass weights is the expectation of a greater proportion of cows in the slaughter mix than expected. The production forecast for 2019 is reduced lower on both lower expected fed cattle slaughtered and lighter cattle carcass weights, although this will be partly offset by higher cow slaughter.
Fewer expected placements in 2019
Based on the January Cattle on Feed report – released by NASS on Feb. 22 – there were 1.9 percent fewer net placements and 0.6 percent fewer marketings in December, for a year-over-year Jan. 1 cattle on feed number of 11.7 million head. As a result, the supply of slaughter-ready cattle available in January grew as the number of cattle held on feed over 150 days increased.
The February Cattle on Feed report estimated placements during January were 5.1 percent below 2018, leaving the Feb. 1 Cattle on Feed number slightly above year-earlier levels. Winter weather has likely continued to hinder feedlots’ ability to finish and market cattle in a timely manner.
The 2018 calf crop estimate was revised lower from the July 2018 Cattle report. Although this reduces the pool of cattle that might be expected to be placed in 2019, the 2018 calf crop was still estimated to have increased 1.8 percent from 2017 to 36.4 million calves. For the near term, several factors support expectations that feedlot placements in 2019 will be above 2018 levels. The number of cattle outside feedlots on Jan. 1, 2019, is up nearly 1 percent from a year ago. Included in the cattle outside feedlots are the cattle on small-grains pastures.
The Cattle report also indicated 1.9 million head were on small-grains pastures in the Southern Plains (Kansas, Oklahoma and Texas). This is 27 percent more cattle than at the same time last year. Although the increase seems large, the number of cattle on small-grains pastures last year was low as producers reduced winter wheat planted area in 2017-18.
Lighter weights and fewer marketings could buoy 2019 prices
On Jan. 1, 2019, there were almost 2 percent more cattle in feedlots and about 1 percent more outside feedlots than last year. As expected, improved forage conditions in the Southern Plains allowed producers to stock a greater number of calves on small-grains pasture. However, feedlots’ pace of marketings slowed more than expected in late 2018.
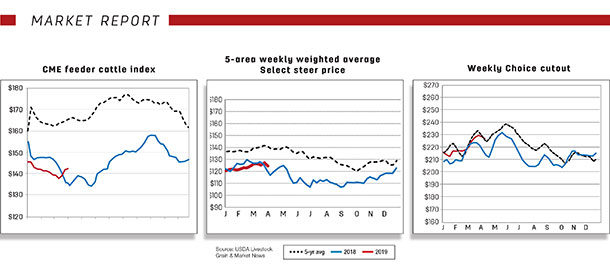
With continued large supplies of cattle in feedlots and a slower expected pace of placements in early 2019, feeder steer prices in first-half 2019 were little changed, but prices in second-half 2019 were raised as calf supplies are expected to be tighter. This brought the annual price forecast up to $141 to $149 per hundredweight (cwt), with a midpoint price of $145 per cwt.
The number of fed cattle marketed in 2019 is anticipated to be lower than in 2018 as feedlots continue to slow the pace of marketings. Since the February Outlook report, fed cattle prices have continued their seasonal trend upward; prices typically peak in the spring.
This reflects a period when fewer fed cattle are slaughtered, carcass weights are lighter, and demand picks up in anticipation of the grilling season, and the current pace of slaughter combined with lower carcass weights could help support higher boxed-beef prices. Based on current price data and expected lower marketings and lighter carcass weights in 2019, the annual price forecast was raised to $116 to $123 per cwt.
Record U.S. beef exports in 2018
Beef exports in 2018 increased about 300 million pounds, or more than 10 percent, to 3.156 billion pounds from 2017. Exports were higher from year-earlier levels to most of the major destinations, excepting Hong Kong and Canada (see Table 1).

This was the third consecutive year of double-digit growth, each year with record-high volumes. Expected overseas demand and readily available exportable U.S. beef supplies result in the 2019 export forecast being unchanged from the previous month’s forecast at 3.255 billion pounds.
U.S. beef exports to Korea exceed 2002 record levels
Fifteen years ago, U.S. beef exports were banned in South Korea after the discovery of bovine spongiform encephalopathy (BSE) in the U.S. at the end of 2003, resulting in the loss of the entire Korean market. Although the ban was partially lifted in 2006, U.S. beef exports have accelerated in recent years since implementation of the United States-South Korea (KORUS) free trade agreement in 2012 (see Figure 1) that reduced tariffs and non-tariff barriers.

South Korea has become a booming market for U.S. beef that contributed more than half of the increase in the volume of U.S. exports in 2018, with 35 percent year-over-year growth. Further, more than 20 percent of total U.S. beef exports were shipped to South Korea in 2018.
Strong consumer demand, lower tariffs than its largest competitor Australia, increased exportable supplies in the U.S. and a relatively weaker U.S. dollar in the first half of the year were likely drivers of this growth. As a result, beef exports exceeded the pre-BSE level of exports to become the largest supplier of beef to South Korea in 2018.
Beef imports fractionally higher in 2018
With 1.7 percent higher year-over-year beef imports in December, U.S. beef imports in 2018 were 2.998 billion pounds. Seven major suppliers contributed more than 98 percent of total U.S. imports. Higher beef production in Canada coincided with an increase of its share of total U.S. imports in 2018 from year-earlier levels. Canada continued to be the largest source of U.S. beef imports. Among major suppliers, year-over-year increases in volume in 2018 were from Canada, Nicaragua, New Zealand and Brazil, while declines in volume were from Mexico, Australia, and Uruguay (see Table 2).

Increased cow slaughter in the U.S. increased the domestic supply of fresh lean meat, which likely pressured imported frozen lean prices. These lower U.S. prices likely diverted some beef shipments from Oceania and Mexico to Asian markets due to price incentives. This is noticeable in that it represents over an 11 percent decline in U.S. imports from Mexico in 2018 compared to a year ago. The 2019 beef import forecast was left unchanged from the previous month at 3.01 billion pounds.
Cattle exports and imports higher in 2018
Year-over-year higher December imports resulted in total U.S. cattle imports up 5 percent in 2018 at 1.899 million head. Increased cattle slaughter in Canada likely reduced shipments to the U.S. for most of 2018. Increased cattle supplies in Mexico from the expansion of its cow herd likely enhanced shipments to the U.S. AMS weekly reports estimated higher year-over-year imports from both Mexico and Canada in the first two months of 2019. Cattle imports for 2019 were revised upward on stronger weekly estimates by 10,000 head from the previous month’s forecast to 1.98 million head.
Although cattle exports in December were lower by more than 15 percent from year-earlier levels, exports in 2018 totaled 238,700 head, up 24 percent from year-earlier levels. Increased shipments to Canada more than offset the decline in shipments to Mexico. Relatively higher feeder prices in Canada compared to the U.S. in first-half 2018, along with increased feedlot demand in Canada throughout the year, were likely drivers of those increases. The 2019 cattle export forecast was unchanged from the previous month’s forecast at 245,000 head. ![]()
Analyst Lekhnath Chalise assisted with this report.
Russell Knight is a market analyst with the USDA – ERS. Email Russell Knight.


