
FMMO administrators reported September 2021 uniform milk prices, PPDs and milk pooling data during the week of Oct. 11. After a tumultus, pandemic-induced period that saw extreme price volatility and dramatically negative PPDs, September’s numbers were almost ho-hum.
Here’s Progressive Dairy’s monthly snapshot of FMMO numbers and their impact on your milk check.
September PPDs smaller
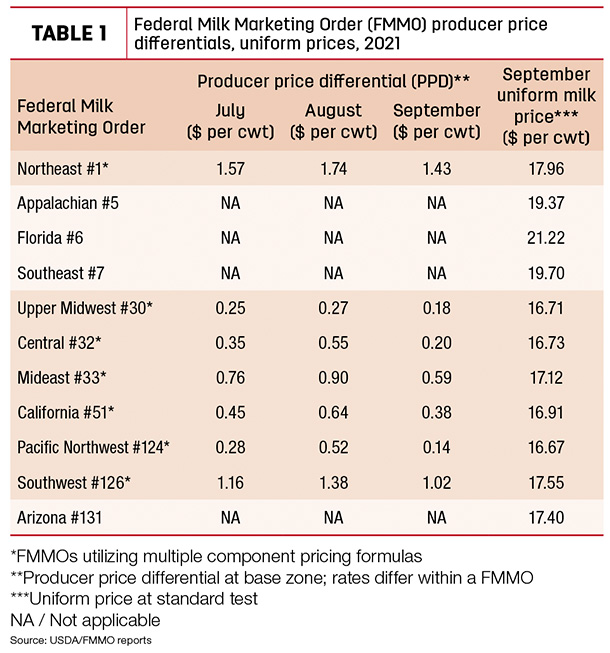
The negative PPDs previously dominating the headlines are becoming a non-story, for now. As they were this summer, September baseline PPDs in all applicable FMMOs were positive, although they were down from July and August (Table 1). And as we note every month, PPDs have zone differentials and vary slightly within each FMMO, and the small baseline PPDs in some orders mean negative PPDs could show up on some producers’ milk checks based on location. Also, whether positive or negative, individual milk handlers may apply PPDs differently, impacting checks to their milk suppliers.
‘Uniform’ prices change little
September 2021 uniform or “blend” prices at standardized test improved slightly from August (Table 1), up in a range of 10-49 cents per hundredweight (cwt) across all 11 FMMOs. The high was $21.11 per cwt in Florida FMMO #6; lows of under $17 per cwt remained in four FMMOs. Factoring into the standardized uniform price calculations, Class I prices were down slightly in September, offset by small increases in Class II, III and IV milk prices.
Compared to August, many dairy producers should see small price increases due to two factors:
- Although mixed nationwide in September, average butterfat and protein tests in many FMMOs increased.
- Cheese and butter prices both improved in September, yielding higher values for both protein and butterfat used in monthly milk price calculations.
At about $2.60 per pound, the value of milk protein in September FMMO milk price calculations rose about 14.25 cents from August but it’s 79.25 cents less than September 2020. The value of butterfat posted an 8.8-cent increase in September to about $1.94 per pound.
Class III-IV price spread remains narrow
As a result, at $16.53 per cwt the September 2021 Class III price was up 58 cents from August and 10 cents more than September 2020. At $16.36 per cwt, the September 2021 Class IV price hit a 21-month high, up 44 cents from August and $3.61 more than September 2020.
September’s 17-cent spread between Class III and Class IV prices was the second smallest since May 2019, keeping FMMO depooling incentives lower.
By volume, total Class III milk pooled across all FMMOs in September 2021 was about 4.4 billion pounds, down from August but still the second most since May 2020, the last month of “normal” marketing patterns before the pandemic-related milk marketing disruptions and cheese-heavy food box purchases.
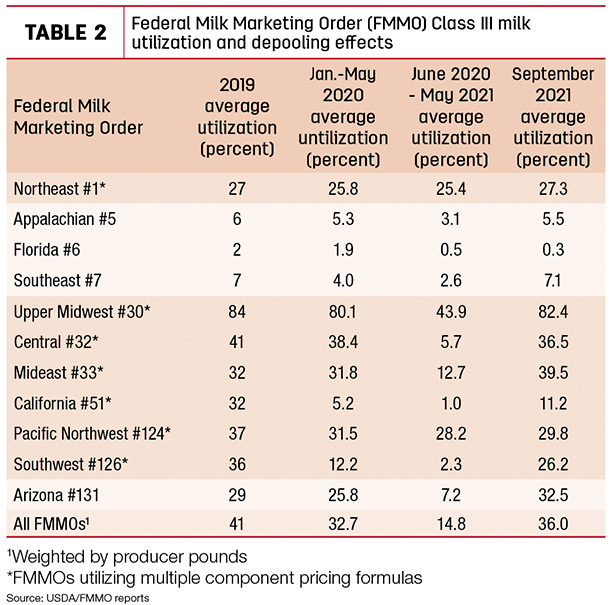
The main outlier in September Class III pooling was in the California FMMO #51. After August’s surge to a two-year high in terms of both volume and percentage utilization, September numbers were down sharply. Elsewhere, Class III pooling in the Upper Midwest FMMO #30 was the highest in 16 months.
On a percentage basis (Table 2), Class III utilization was about 36% of all FMMO milk marketings in September 2021, down from 38.5% in August but well above the 14.8% average during June 2020-May 2021. Class III utilization during July-September 2021 has inched closer to the pre-pandemic utilization rate of 41% for all of 2019.
Class I mover
That closer Class III-IV price relationship, and therefore the narrow gap between the FMMO Class III-IV skim milk price factor used to calculate Class I prices, means producers will see a net benefit from using the “average of plus 74 cents” formula compared to the previous “higher of” formula next month.
What’s ahead?
Looking into the fourth quarter of 2021 and beyond, factors affecting depooling, negative PPDs and the Class I mover seem to have steadied.
Markets fluctuate almost daily but based on closing futures prices on the Chicago Mercantile Exchange (CME) as of Oct. 13, average spreads between Class III and Class IV milk prices increase in October and November, averaging about 93 cents per cwt. After that, however, it’s another story.
While Class III milk futures prices have improved, recent gains in the Class IV market have been even stronger. As of Oct. 13, Class IV milk futures prices settled at or higher than Class III milk futures prices through the first five months of 2022. Based on monthly futures settlement prices for all of 2022, the spread between Class III-IV prices would be just 10 cents per cwt.
Near term, the October 2021 advanced Class I base price is $17.08 per cwt, up 49 cents from September 2021 and $1.88 more than October 2020. Class III-IV milk prices won’t be announced until Nov. 3, covering component prices for Oct. 2, 9, 16, 23 and 30. As of the close of CME trading on Oct. 13, Class III and Class IV milk futures prices closed at $17.88 and $16.95 per cwt, respectively.
What was in your mailbox?
Looking further back, the impact of mostly positive PPDs beginning in June has reduced the differences in two monthly milk prices reported by the USDA. The June 2021 spread between the average “all milk” and “mailbox” prices was about 85 cents per cwt, the slimmest range since the first half of 2020.
The all-milk price is the estimated gross milk price received by dairy producers and includes quality, quantity and other premiums but does not include marketing costs and other deductions.
The mailbox price is the estimated net price received by producers for milk, including all payments received for milk sold, and deducting costs associated with marketing.
The USDA National Ag Statistics Service (NASS) reports monthly average all-milk prices for the 24 major dairy states. The mailbox prices are reported by the USDA’s Agricultural Marketing Service (AMS) and covers selected FMMO marketing areas. The AMS announcement of mailbox prices generally lag all-milk prices by a couple of months.
Through the first six months of 2021, the USDA’s mailbox prices averaged about $1.16 per cwt less than average all-milk prices for the same months. During that period, all-milk prices averaged $18 per cwt, while mailbox prices averaged $16.84 per cwt.
Dairy Margin Coverage (DMC), Dairy Revenue Protection (Dairy-RP) and Livestock Gross Margin for Dairy (LGM-Dairy) programs are all based on the all-milk price, before any marketing cost deductions, affecting risk management capabilities. ![]()
-
Dave Natzke
- Editor
- Progressive Dairy
- Email Dave Natzke


