U.S. milk producers again saw a decrease in average somatic cell counts (SCC) based on an annual summary of Dairy Herd Improvement (DHI) test-day results.

Nationally, the average 2023 DHI test-day herd SCC was 181,000 cells per milliliter (cells per mL), down 1,000 from 2022, according to a summary report from the Council of Dairy Cattle Breeding (CDCB) and compared to previous reports from CDCB and the USDA’s Animal Improvement Programs Laboratory. Although small, the year-to-year decrease was the first since 2020.
SCC test-day data comes from herds on any DHI test plan (including owner-sampler recording). Reflecting an ongoing trend, herds and test-day totals are down from the previous year: The 2023 results included 8,947 herds and approximately 3.8 million cows.
Individual state data
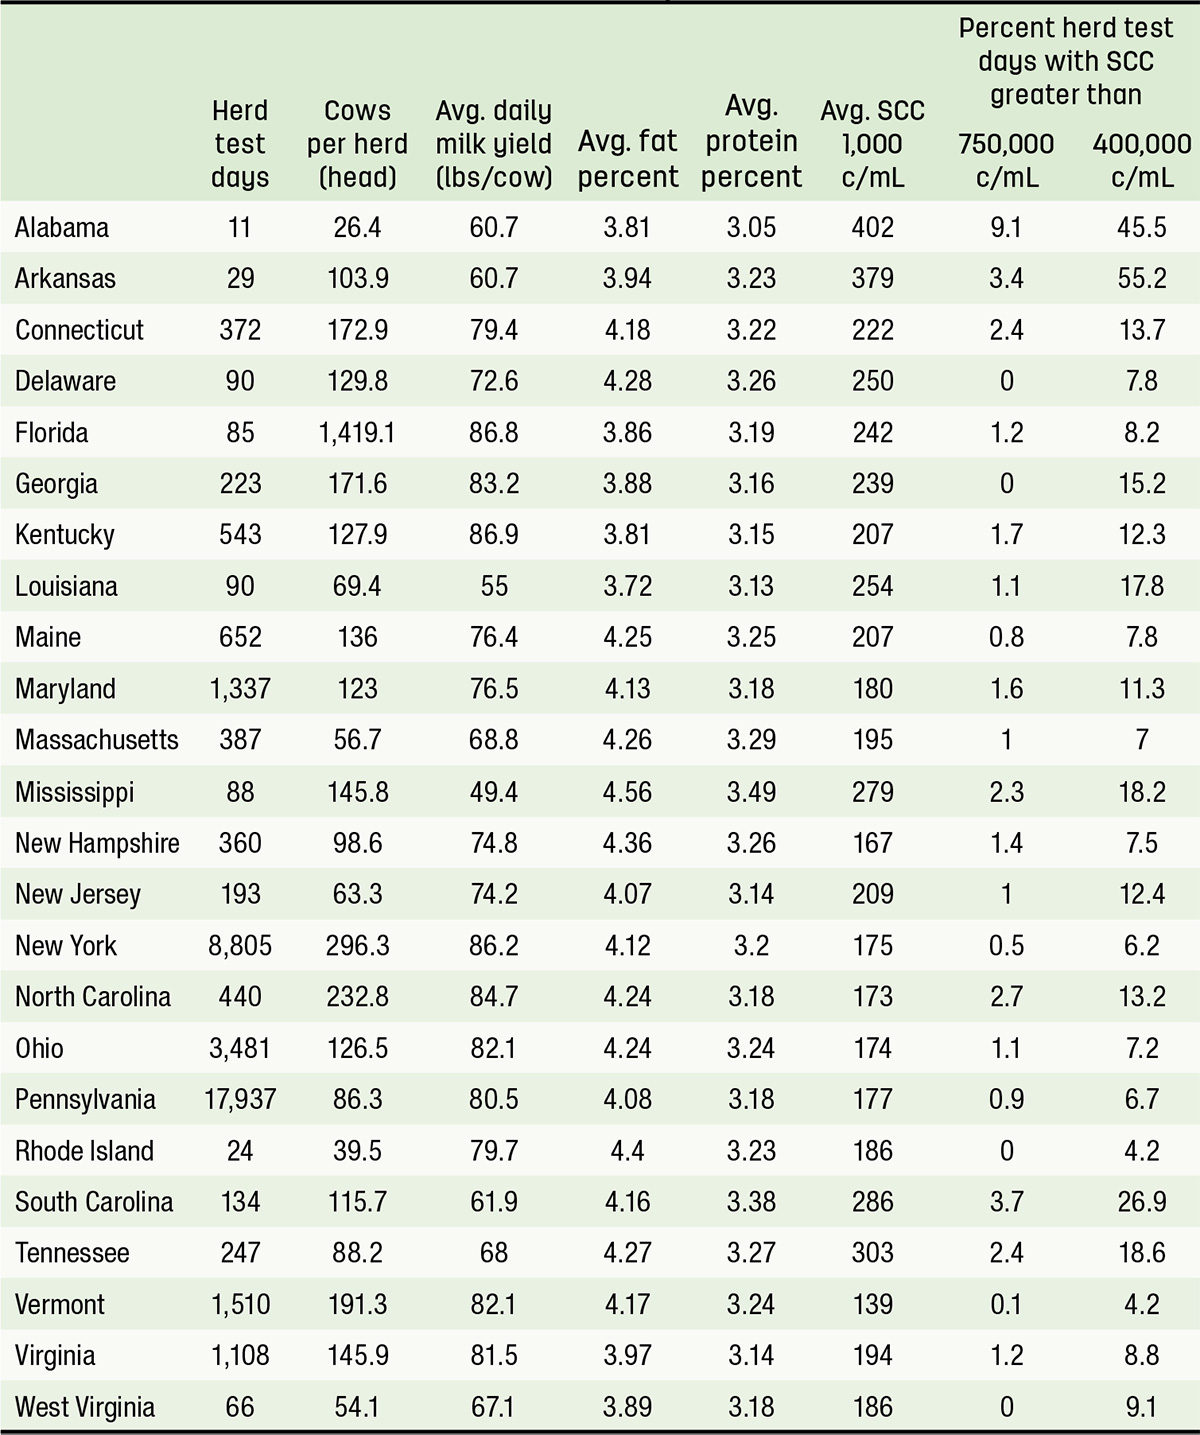
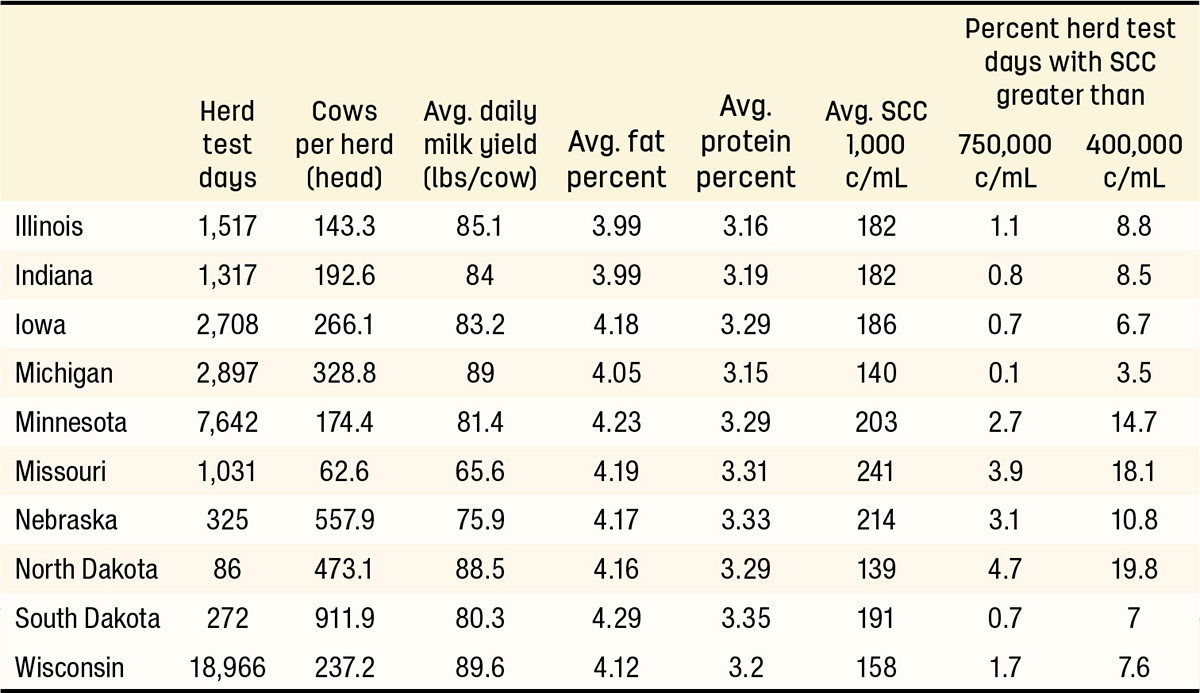
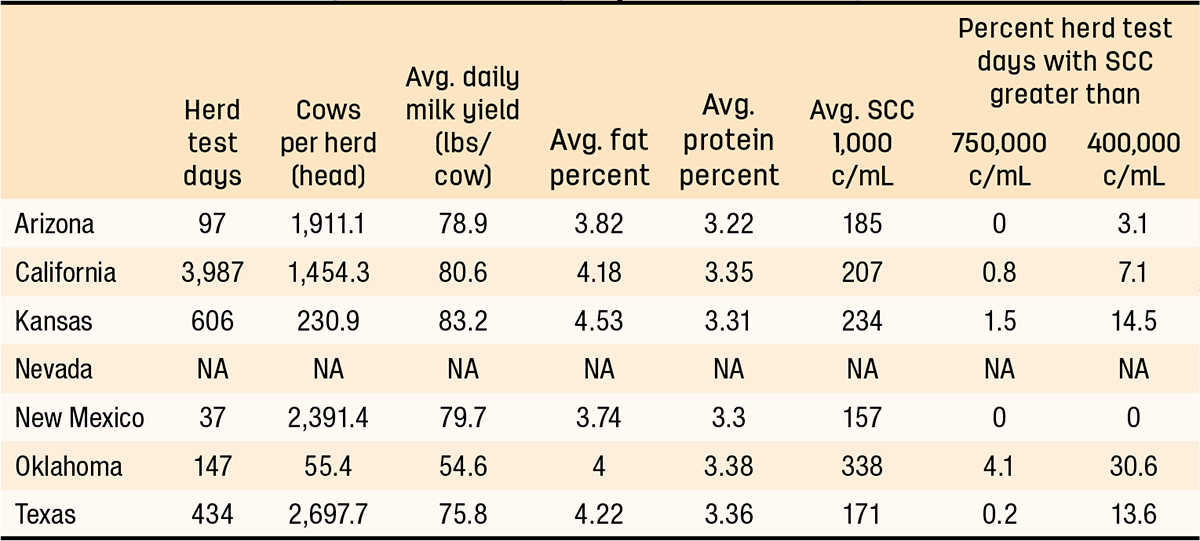
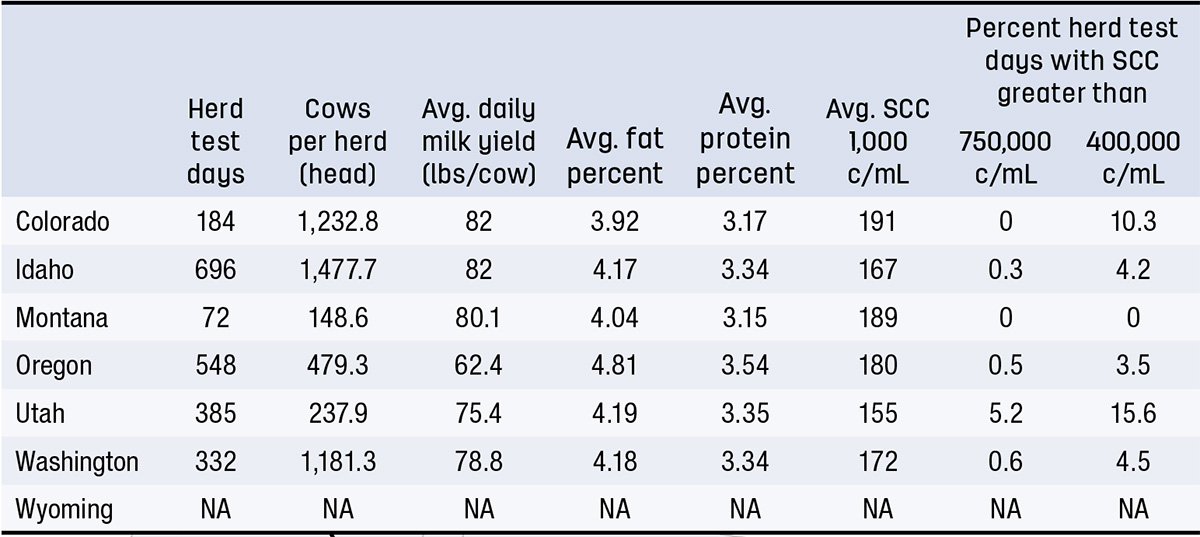
Tables featured here include state data for herd test days, average number of cows per herd, average daily milk yield, butterfat and protein percentages, and average SCC. It also breaks out two categories of SCC levels: the percent of days over 750,000 cells per mL (the current federal limit for bulk tank SCC for Grade A producers) and the percent of test days over 400,000 cells per mL (the current maximum level for milk used to produce dairy products for export).
Herd test days higher than the federal limit may overestimate the percentage of herds shipping milk exceeding that limit because milk from cows treated for mastitis is excluded from the bulk tank, even though it is included in DHI test data.
A few states have lower SCC limits compared to federal requirements: California – 600,000 cells per mL, Oregon – 500,000 cells per mL, Idaho and Washington – 400,000 cells per mL.
Four (Central, Mideast, Southwest and Upper Midwest) of the current 11 Federal Milk Marketing Orders (FMMOs) adjust milk payments to producers based on the SCC in raw milk. Price adjustments are made on a per hundredweight basis for every 1,000 cells per mL variation from 350,000 cells per mL. Positive payments are made for SCCs below that level and negative adjustments are made for milk with higher counts. The magnitude of the SCC adjustment varies monthly based on the wholesale price of cheese.
State variations
Variation in SCC among states remains large, in part, but not necessarily all, due to climatic conditions (temperature and humidity). Average annual SCC in 16 states was at or less than the national average, led by Vermont and North Dakota. Alabama, Arkansas, Oklahoma and Tennessee averaged more than 300,000 cells per mL.
DHI data showed that 22 states improved annual average SCC in 2023, with 11 states improving by 10,000 cells per mL or more. Largest improvements were in Rhode Island, North Dakota and New Jersey. Year-over-year annual average SCC increased in 22 states, rising by 30,000 cells per mL or more in Alabama, Oklahoma and Colorado.
Herd sizes compared
Cow numbers in DHI herds increased by about 18 in 2023, to 288. Based on herd size, year-over-year changes in SCC levels were mixed. DHI herds greater than 4,000 had the largest increase in SCC compared to a year earlier. Also posting a small increase was herds with 500-999 cows. Those lowering average SCC levels from the year before were herd categories with less than 50 to 299 cows and categories with 1,000-3,999 cows.
Monthly breakouts
U.S. average SCC levels were also mixed compared to the same month a year earlier, increasing in March-April and October, holding steady in November, and declining in January-February, May-September and December.
Milk, fat and protein data
Test-day average milk yield rose a little over one-half pound to 83 pounds, with fat percentage up 0.07% to 4.15% and protein percentage up 0.01% to 3.26%. The milk with the highest component percentages was produced in November and December; lowest component percentages were produced July through August.