


Just as financial indexes are used to gauge the overall health of an economy, many different metrics exist to express the relative impact of certain activities on the health of our climate.

Carbon intensity is a metric that puts all the greenhouse gas (GHG) emissions associated with an activity in terms of the amount of product generated. For example, if you produce 100 pounds of milk and emit 100 kilograms of GHG emissions (expressed as carbon dioxide equivalents or CO2e) to produce that milk, the total GHGs emitted, known as the “absolute” emissions, would be 100 kilograms of CO2e. The “carbon intensity” of the milk would be 1 kilogram of CO2e per hundredweight (cwt) of milk.
While this simple conversion may seem trivial, expressing emissions in terms of everyday items is remarkably powerful. Using a relative measure enables producers, retailers and consumers to evaluate the climate impact of different products by thinking about them in terms of emission efficiency. This comparison allows for the establishment of product-specific climate benchmarks, which is why some brands would like farms to eventually be as familiar with the carbon intensity of their milk as they are with their somatic cell count (SCC) or herd average.
What is U.S. dairy’s carbon intensity?
The U.S. dairy industry has set a goal to achieve GHG neutrality by 2050, meaning all GHGs emitted during milk production in the U.S. would be balanced through a combination of reducing emissions and removing CO2 from the atmosphere through carbon sequestration.
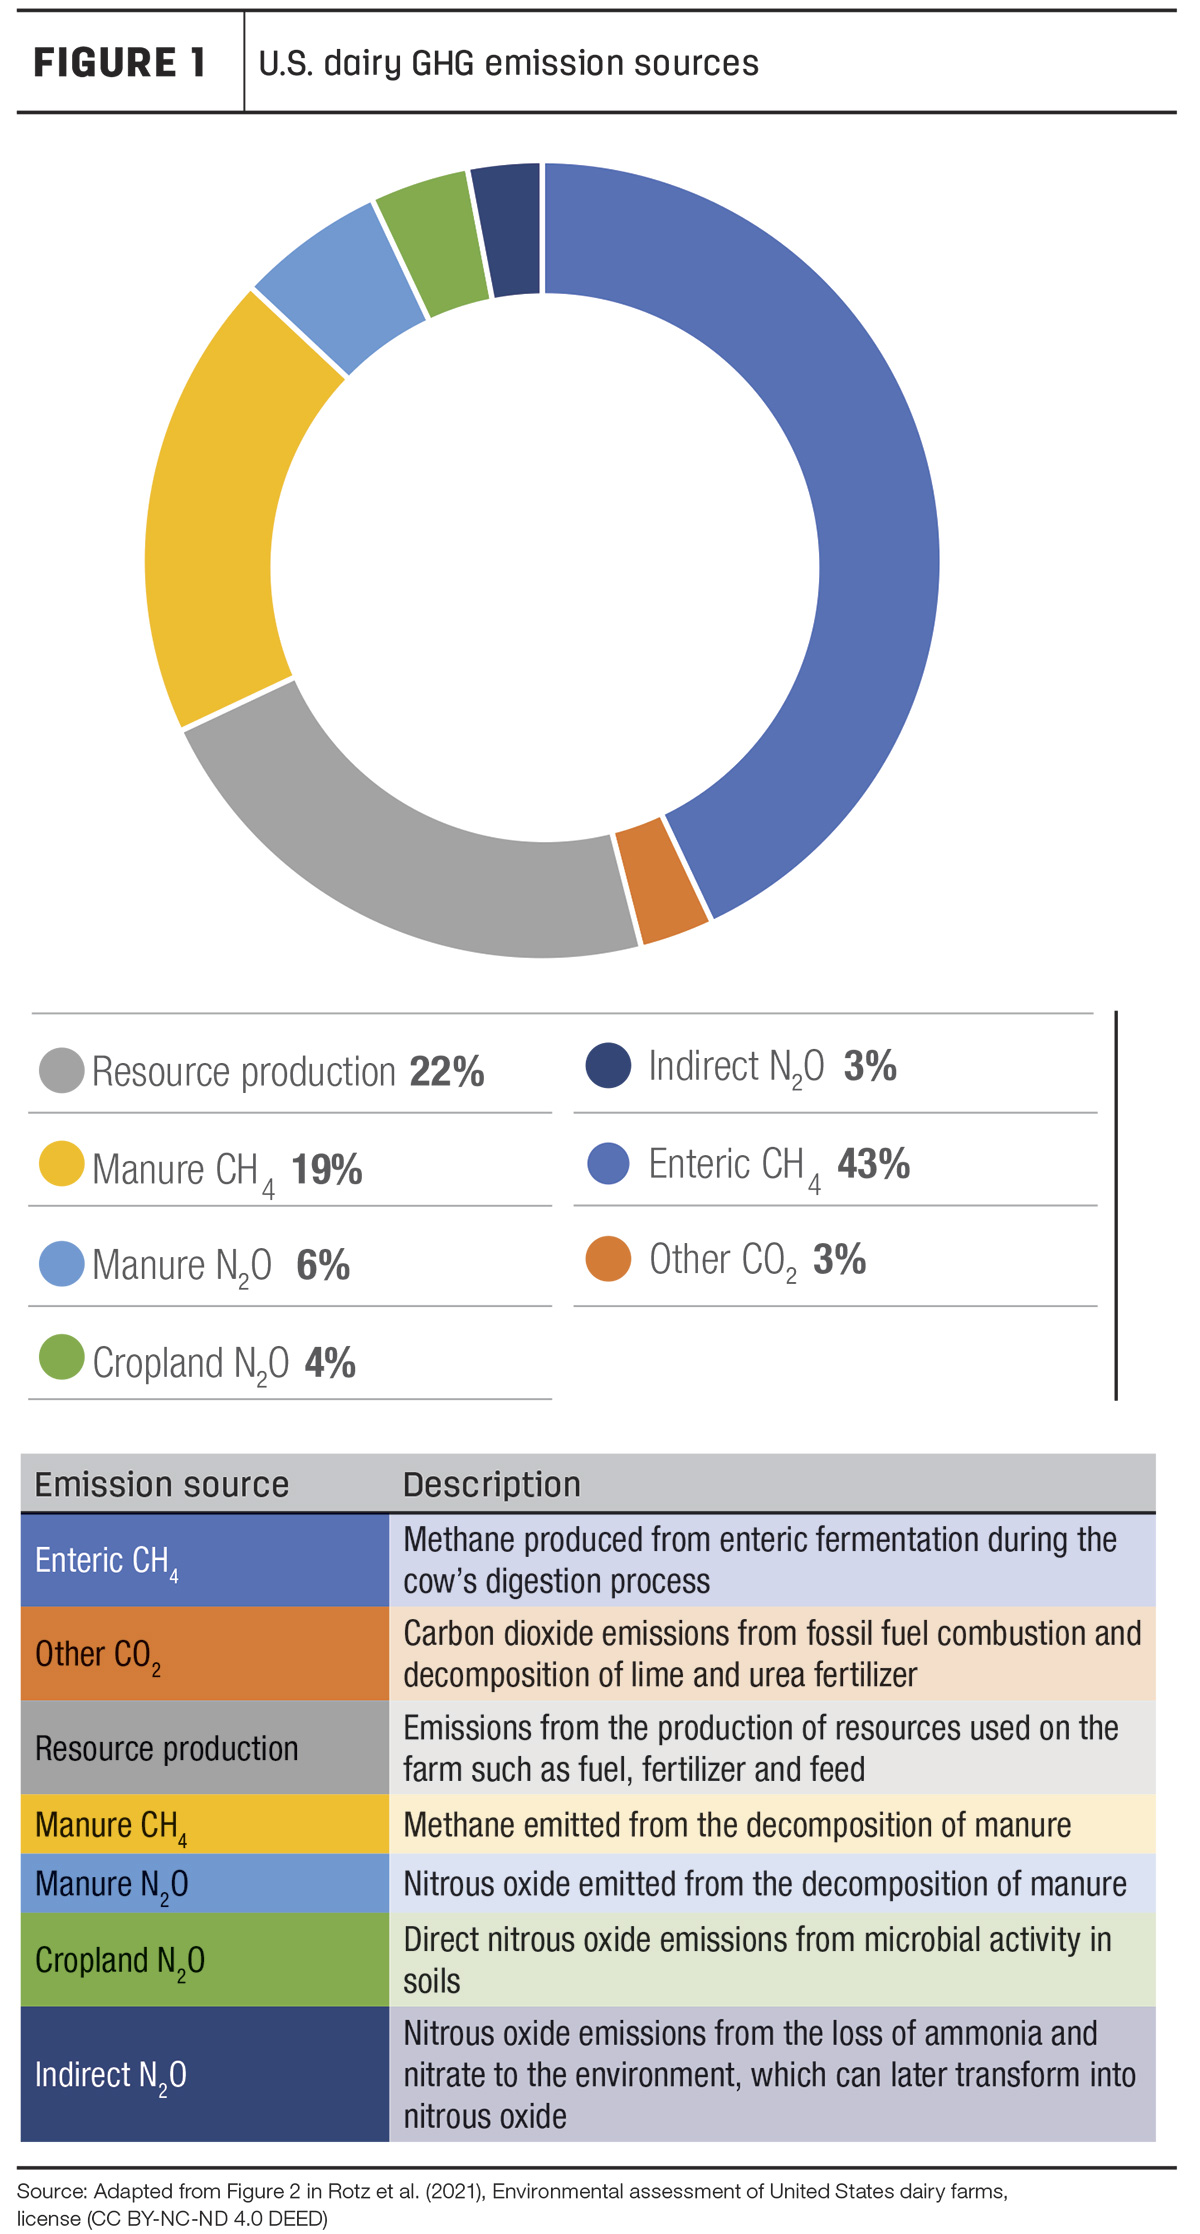
While this goal is significant and marks a major step for the industry, it is challenging to fully comprehend without considering the current climate impact of milk production. Research conducted by the American Dairy Science Association calculated the average carbon intensity of U.S. milk in 2020 at 1.3 kilograms CO2e per kilogram milk, when only including emissions from activities at the farm level. Applying this carbon intensity to the estimated 100 billion kilograms of total milk produced in 2020 comes out to just over 130 million metric tons of CO2e emitted by the dairy sector. Figure 1 breaks down where these emissions came from.
According to the study conducted by the American Dairy Science Association, in order to become climate neutral by 2050, meaning milk production would produce no additional warming to the planet relative to 2020 the average field-to-farmgate carbon intensity of milk will need to decrease by almost 50%. I.e. from 1.3 to 0.67 kg CO2e/kg milk. While on-farm emissions can be lowered through low-carbon practice changes and technologies, there will always be residual emissions that are difficult to abate. Therefore, for a dairy to actually achieve GHG neutrality, additional measures would need to be taken to permanently sequester CO2 from the atmosphere in the soils in order to balance any residual emissions.
While no single solution can achieve this industry-wide goal, there are numerous actions individual farms can take to contribute to it. Part of the beauty of dairy farms is the variety of solutions and management practices that have developed over time. This also means emissions sources and the available opportunities to reduce them can have just as much variety, so to fully understand how your farm fits into the bigger climatic picture, you first have to determine your farm’s unique carbon footprint.
What goes into calculating dairy’s carbon intensity
While there are a plethora of tools and models out there used to calculate a dairy’s carbon intensity, most of the calculations rely on the same general categories of data: herd size and livestock types, milk production, feed rations, manure management, and energy use and transportation. A more in-depth description of the typical information needed to calculate a dairy’s carbon intensity can be found in Table 1.
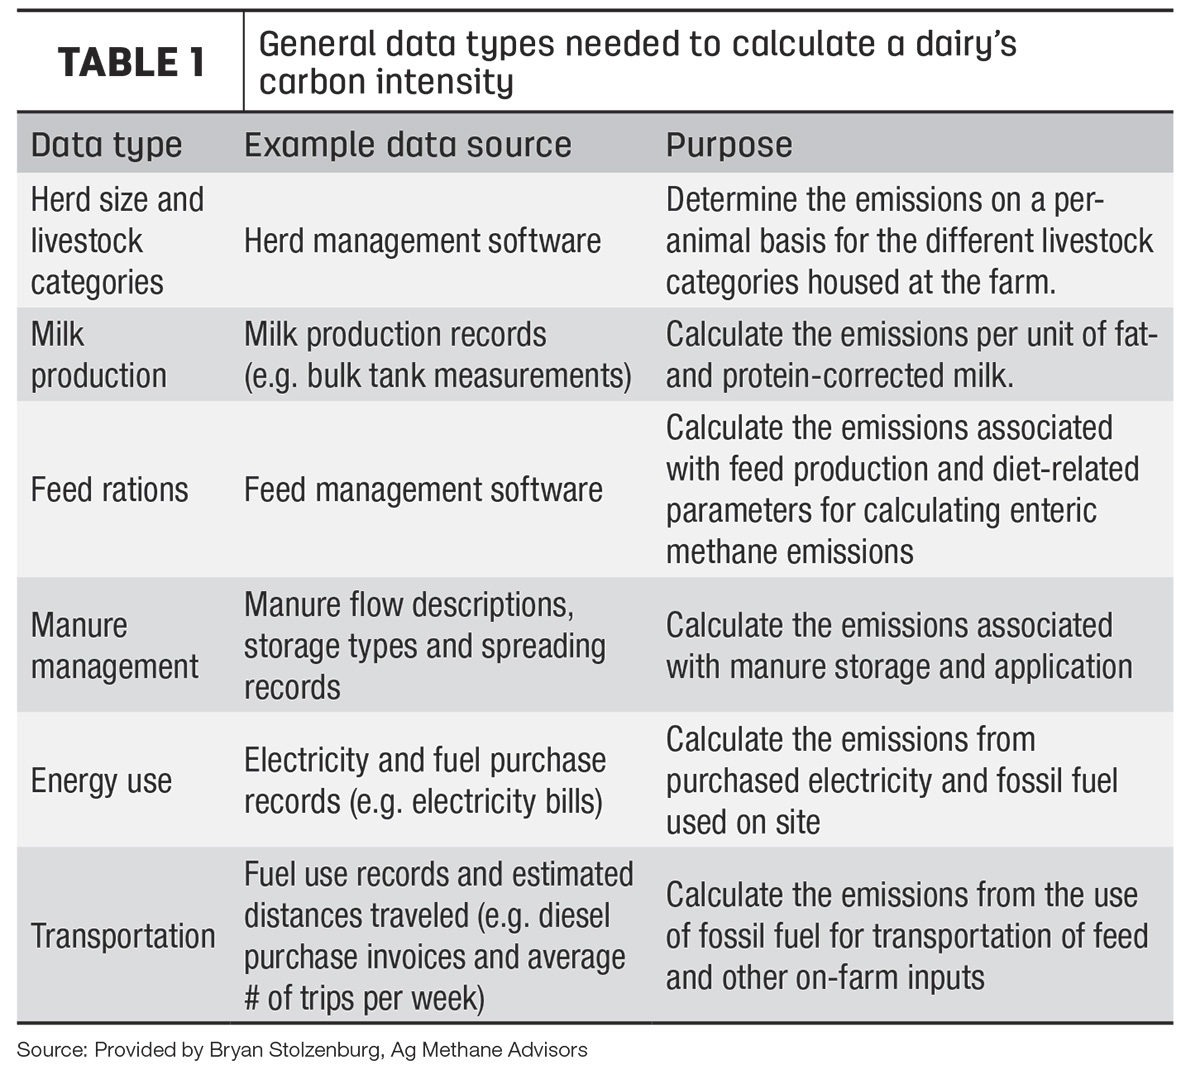
While this list is by no means exhaustive, it provides a birds-eye view of the information used to calculate a dairy’s carbon footprint. Luckily, much of the necessary data is likely already available in some form as part of a typical dairy’s regular operations.
One well-known example of a tool used to calculate farm footprints is the Cool Farm Tool (the CFT). This web-based modeling tool relies on numerous published datasets and accredited methodologies to calculate a farm’s (or group of farms) carbon intensity and identify the biggest on-farm emission levers, even allowing for “what if” analyses to model the potential impact of certain on-farm interventions. While the CFT and other GHG calculators are providing farmers and processors with a means to quantify their climate impact, they are also being leveraged by many major brands to incorporate climate performance indicators into their supply chains and track progress toward their own sustainability goals.
Corporates, carbon intensity and incentives
For the world's largest food brands, balancing the increased demand from growing populations while continuing to make progress toward ambitious climate targets is only possible through farmer engagement. This need is especially apparent in the dairy industry, where the majority of emissions from dairy products originate from on-farm activities that are spread across complicated supply chains. For a deeper dive on these supply chain emissions and their important role, read “Beyond the barn: Dairy farmers’ role in driving bottom-up change in supply chain emissions.”
Multiple big-name brands are attempting to tackle this challenge head-on, with some notable examples:
- As part of Danone's Climate Transition Plan, they have been using the CFT to calculate their milk producers' emission factors (i.e., carbon intensity) to incorporate (along with other climate performance indicators) into supplier contracts. This will enable them to progress toward their targets of a 30% reduction in methane emissions from fresh milk by 2030 and to source 30% of ingredients from farms practicing regenerative agriculture by 2025.
- According to the CFT’s 2023 Impact Report, Strauss Family Creamery also uses the tool to track the emissions profile of their suppliers, leveraging the results to structure practice-based incentives for farmers, which can amount to an additional 1% to 5% on milk premium payments for farmers who adopt sustainable practices and do measurement and monitoring using the CFT.
- Also included in the CFT's 2023 Impact Report, Unilever has been using the tool since 2011 to collect data on their supply chain to develop their Sustainable Agriculture Code, which identifies criteria for suppliers that qualify them for third-party certification as a sustainable supplier.
These are just a few examples of companies using climate performance indicators (such as carbon intensity) to structure future sourcing requirements and incentives for producers, with more and more companies expected to adopt similar emission reduction targets in the coming years. For farmers, learning more about what drives your milk’s carbon intensity puts you in a better position to comply with updated procurement policies and to realize additional revenue from practice-based incentives.
Conclusion
With advances in GHG models, and the incorporation of these models into global dairy supply chains, learning more about your farm's carbon intensity is a way to contextualize your own impact compared to the rest of the industry and to identify which practice changes align best with your goals and the industry’s goals.
With the combined pressures of climate policies and consumer preferences driving demand for sustainable dairy products, carbon intensity will likely play a key role in determining the value of low-carbon milk and what brands are willing to contribute to help produce it.
The details of how this trend materializes remain to be seen, but what is certain is that decarbonization efforts at the farm level will shape the future of the dairy industry for years to come.
References omitted but are available upon request by sending an email to the editor.


