What is one of the most valuable things you can possess to run your dairy? Information – accurate information. What if a source of information you have relied upon in the past – that brought you success – has now become a source of misleading information?

It is becoming commonplace for dairy producers to shift to utilizing genetic herd audit rankings to propagate their superior female genetics into the next generation, utilizing female-sorted semen and capitalizing on a growing demand for beef-on-dairy entrants into our beef supply chain. The females targeted for populating the next generation are ranked for their genetic superiority based on health, fertility and lifetime productive ability. The question is: How much should the linear selection factor be used to identify the mothers of your replacement females? In other words, how one uses or doesn’t use linear type traits will influence the females you identify as having the genetics you wish to propagate.
Linear selection is two-dimensional, straightforward and very directional. Terms such as “taller, stronger, higher, wider, shallower, closer” are used in linear selection. Today we hear our cows are “Too tall, too frail and their teats are too short, and their rear teats are too close together.” We now hear statements such as, “I want moderate frames, correct teat placement and intermediate optimums.”
When we look at linear picture boxes, those linear sections in promotional literature were designed to quickly tell us if each linear trait is expressed in the “right” direction, namely to the right of “0.00.” This reference became a quick hedge that we were selecting the right bull, or at least a “safe” bull. If a bull had a trait or two of concern to the “left,” we immediately turned the page. We have been trained to think that bulls with negative linear traits would sire inferior offspring of subpar value, and the lifetime performance would be inferior. One might say that our traditional linear profile charts have become misleading at best, if not altogether archaic in their ability to project what we are really trying to accomplish, namely identifying cows that represent our operation's true type model cows.
A broader perspective
We must first recognize that we are not just comparing the direction of a trait relative to the contemporary populations, as each updated base change suggests. Most of our linear traits have a historical base point from which we have been moving in the direction we have selected for the past three to four decades.
The base value for each trait is updated for display purposes every five years to a zero-sum of the movement we have observed during the prior period. This adjusted 0.00 base point is utilized to share the differences in the contemporary populations, not a summary of how far a trait has moved in the last 50 years.
For example, Stature in U.S. Holsteins has risen 5.5 inches (14 centimeters) over the past five decades. A Holstein bull today with a Standard Transmitting Ability (STA) of 0.00 in regards to Stature has daughters who are 57.5 inches (160 centimeters) vs 52-inch cows (132 centimeters) that were at 0.00 STA Stature 50 years ago. That is why using a bull with an STA of -3.00 Stature today would result in daughters who average 56.5 inches (143.5 centimeters), which is still 4 inches (10.2 centimeters) taller than the average Holstein cow 50 years ago.
Interpreting STAs
According to the Holstein Association USA, linear-type trait genetic evaluations are first calculated as Predicted Transmitting Abilities (PTAs), similar to the production traits, and for final score. However, expressing their varying units (points) on the same graph is nearly impossible. Therefore, a practical solution of standardizing each trait into their STAs has allowed for easily comparing different traits of the same bull.
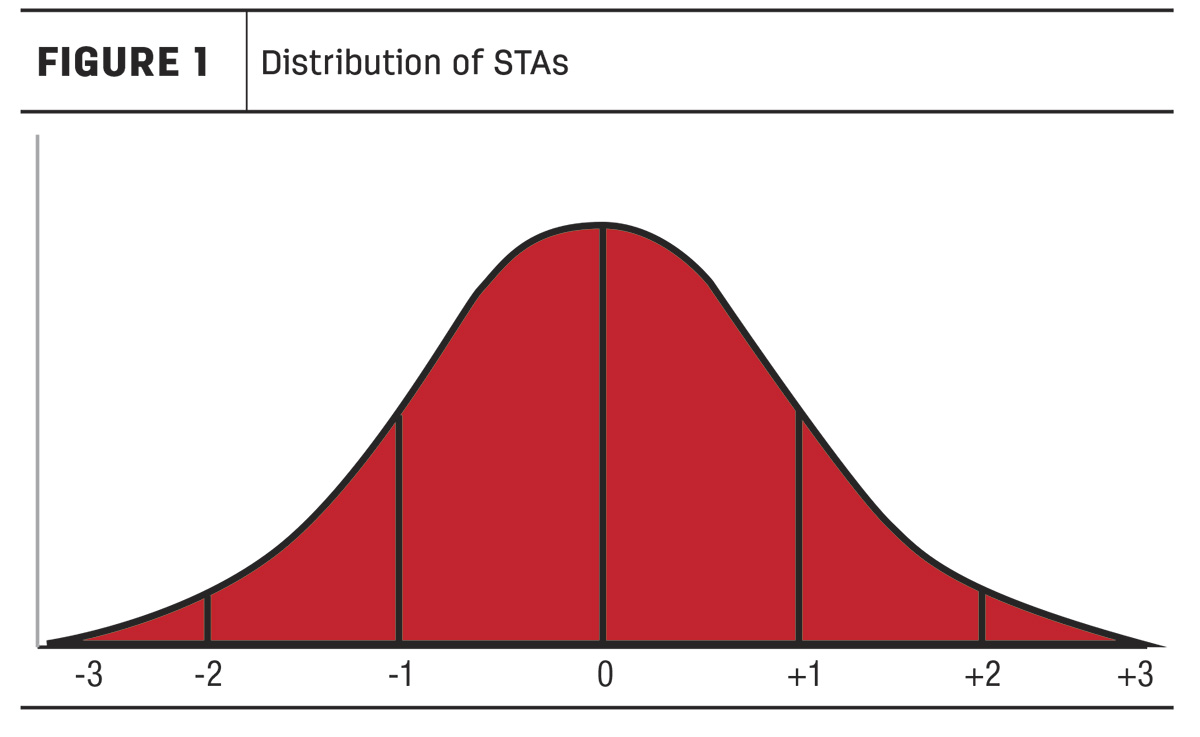
The range of STA values is the same for all traits. Sixty-eight percent (68%) of the STA values are between -1.0 and +1.0. Ninety-five percent (95%) of STAs have values between -2.0 and +2.0, and 99% of all STAs are between -3.0 and +3.0.
Figure 1 is called a bell-shaped curve. A zero (0.00) STA value represents the breed average for that trait. Breed average is defined as a 5-year-old cow, born in 2015, and milking in the fifth month of her third lactation. Knowing the STA of a bull (or cow) tells you whether their future progeny should be above or below average compared to the base population for that particular trait.
However, STAs do not allow you to easily determine how different a bull's average daughter is from the breed average. The average progeny scores corresponding to STAs for each trait are presented in Table 1. For example, the average mature daughter of bulls with a -3.0 STA for Stature will score 32.2 points. In contrast, the average mature daughter of bulls with a +3.0 STA for Stature will score 43, a difference of 10.2 points.
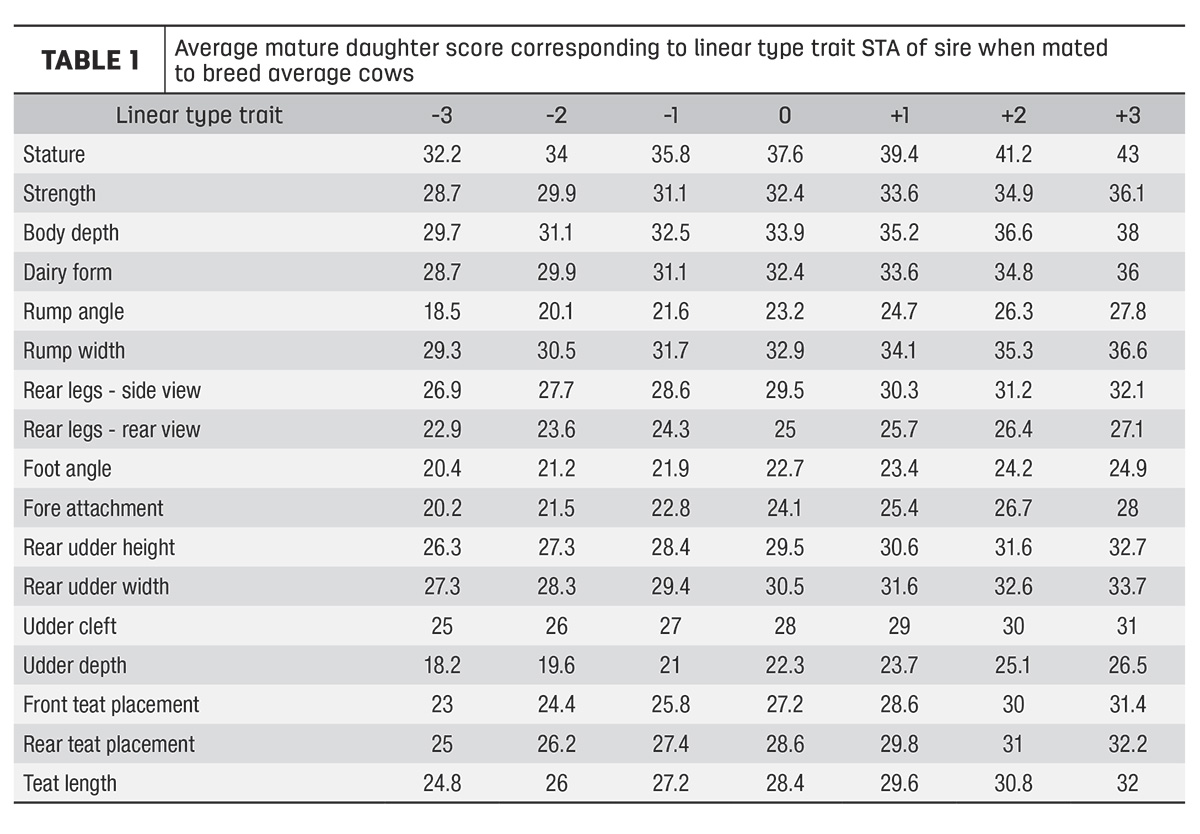
Stature has the highest heritability (0.42) of all evaluated type traits and consequently the greatest range in average daughter scores. Breeders can increase (or decrease) their future herds' average score for Stature much faster than other traits with lower heritability even when the mating sires have identical STAs for both traits.
Upon first studying Table 2, you may think the average daughters of the most extreme bulls are quite similar. For example, 2 inches of Stature (average difference between daughters of bulls with a +3 STA for Stature and -3 STA for Stature) may appear to be small, but remember these differences accumulate over generations.

Each generation interval is approximately six years, so over 30 years you can increase (or decrease) your herd's average stature by 5 inches compared to the breed average. Relatively small changes in each generation can result in dramatic changes over time.
If you started with only very tall cows (Stature STA = +3.0), the resulting progeny would be even taller. Their expected Stature score would average 45.3 points, and they would average about 59.1 inches (151 centimeters) tall.
What about rear teat placement? We did not even begin to measure this trait until it became evident that rear teats were too close together. How did that happen? Linear selection. When did we historically select for 0.00 teat position for bulls? We had decades where our protocols included selecting “Plus” for teat placement, which only measures front teat placement. Guess what happened to rear teat placement when we put selection pressure on front teat placement? Is there a pattern here?
Am I saying we’ve gone too far? Yes.
Utilizing a current tool
So, if we’ve gone too far – now what?
Abandon linear values? Or find a new way to interpret and utilize them? Maybe we already have that tool or instrument in place: indexes. Not composites, indexes.
It seems our composites, while seemingly a good idea, have been contributing to the problem. They are simply a combination of linear values attempting to create one selection value. Udder composite contains all values, which leads to overreaching any intermediate teat placement wishes. Foot and Leg (F&L) composite and its close relatives have not worked either, as they are even more subjective in values. Again, there are intermediate options versus more extremes when trying to create a single value.
Indexes, however, operate differently. Indexes take the integrity of a trait and place a weighted value or level of importance on it relative to a cow a producer has identified as the ideal cow for a given environment. If a particular cow size or shape has relevance for a cow’s ability to last and perform at her highest levels, weighting for those relevant traits is appropriate. If a given health trait such as mastitis is a challenge in a cow’s environment, weightings for mastitis should find their way into that index. Even including small weightings for low-heritability health traits brings value to the index, as it aids in screening out genetics at extreme levels. The mistake we often make is trying to use minimum-level cutoffs to screen out unwanted genes and screening out genetic profiles that would positively contribute to our selection process.
The key is to identify the right index for the right cows for the environment you are asking them to thrive in and perform to their maximum genetic potential.