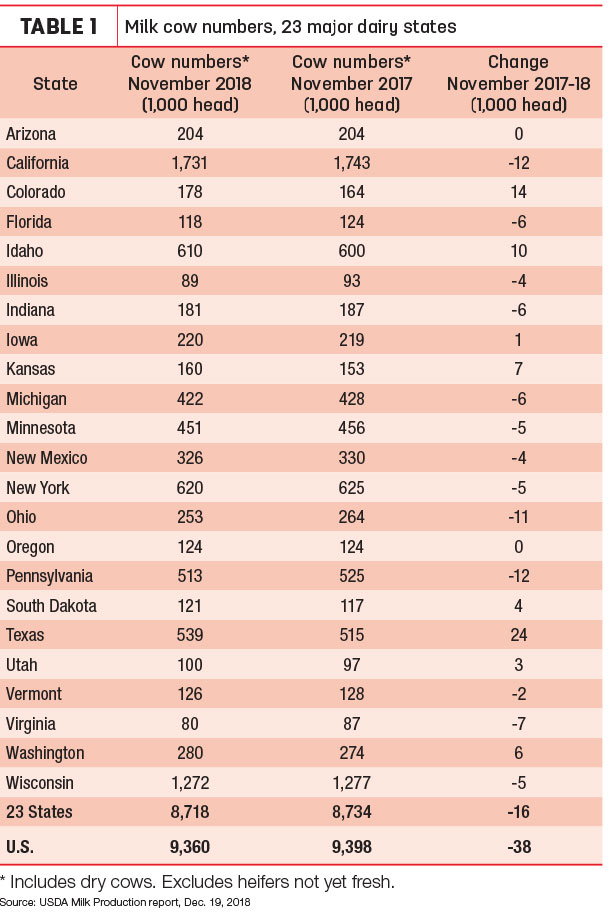
For the second consecutive month, November 2018 U.S. milk production increased less than 1 percent from the same month a year earlier, as cow numbers continued to decline. With November’s estimate, U.S. milk production growth has now been under 1 percent in five of 11 months in 2018, according to USDA’s monthly Milk Production report, released Dec. 19.
The USDA’s preliminary estimate put November 2018 cow numbers at 9.36 million head, down 8,000 head from October and 38,000 head fewer than November 2017. It’s the lowest number since January 2017. Cow numbers in the 23 major dairy states totaled 8.718 million head in November 2018, down 8,000 from October, 16,000 less than a year earlier, and the lowest since March 2017.
November 2017-18 recap at a glance
Reviewing the USDA estimates for November 2018 compared to November 2017:
- U.S. milk production: 17.37 billion pounds, up 0.6 percent
- U.S. cow numbers: 9.36 million, down 38,000 head
- U.S. average milk per cow per month: 1,856 pounds, up 19 pounds
- 23-state milk production: 16.37 billion pounds, up 0.8 percent
- 23-state cow numbers: 8.718 million, down 16,000 head
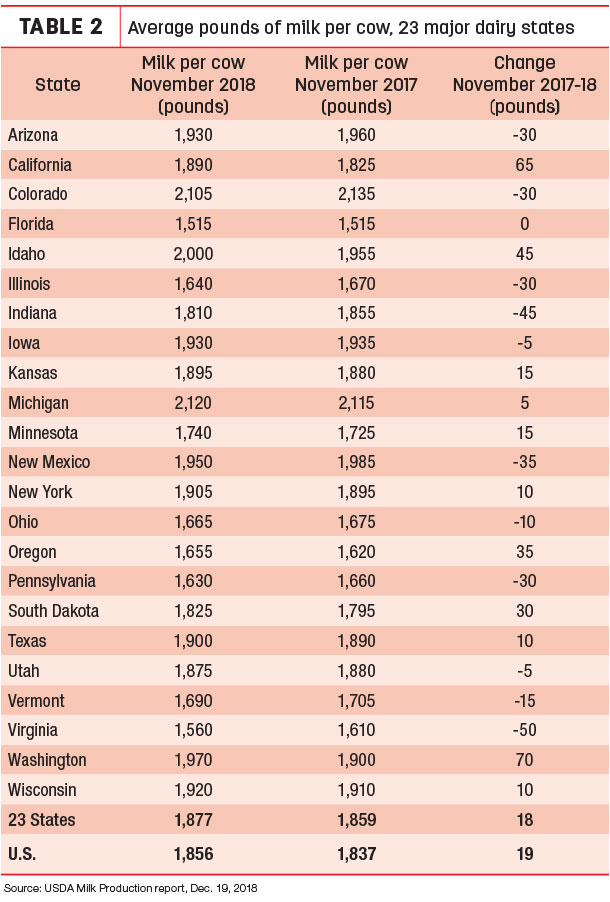
- 23-state average milk per cow per month: 1,877 pounds, up 18 pounds
Source: USDA Milk Production report, Dec. 19, 2018
State data
• Cow numbers: Eight states increased cow numbers (Table 1) compared to November 2017, led by Texas (+24,000 head), Colorado (+14,000 head) and Idaho (+10,000 head). Compared to a year earlier, California and Pennsylvania were each down 12,000 head, with Ohio down 11,000 head. Cow numbers were down a combined 16,000 head in Michigan, Minnesota and Wisconsin.

• Milk per cow: With cow numbers down, increased milk output per cow boosted overall milk production in November. Washington’s milk production per cow was up 70 pounds compared to a year earlier, with California cows each up 65 pounds of milk (Table 2). Cows in Arizona, Colorado, Illinois, Pennsylvania, New Mexico, Indiana and Virginia were each down at least 1 pound of milk per day compared to the same month a year earlier.

• Milk production: Compared to a year earlier, November 2018 milk production was down 10.7 percent in Virginia and at least 4 percent in Florida, Illinois, Indiana, Ohio and Pennsylvania, with most declines due to lower cow numbers and less milk per cow. In contrast, production was up 5 percent or more in Colorado, Kansas, South Dakota, Texas and Washington. All had more cows than a year earlier.
California led all states for milk production growth on a volume basis, up 91 million pounds compared to a year earlier. Texas, Colorado, Idaho and Washington combined to increase production another 154 million pounds. On the other hand, Pennsylvania and Ohio production was down a combined 57 million pounds.
Outlook updated
Based on lower expected milk prices and relatively high slaughter rates, the USDA’s latest dairy outlook report reduced average milk cow numbers for the fourth quarter of 2018 to 9.36 million head, the lowest quarterly average since October-December 2016. The U.S. herd is expected to average at 9.385 million for all of 2018, dipping to 9.365 million during 2019.
Fourth-quarter 2018 milk production per cow was forecast at 5,730 pounds, 10 pounds less than projected last month. The milk per cow forecast for 2019 was lowered from previous projections, to 23,555 pounds.
Read: 2018-19 USDA milk production forecasts lowered, but price outlook no better
Cutter cow price outlook little changed
The USDA’s latest Livestock, Dairy and Poultry Outlook forecasts steady to weaker national average cutter cow prices through most of 2019.
After averaging about $61.50 per hundredweight (cwt) in the first half of 2018, third-quarter prices dipped to $57.74 per cwt and are expected to average less than $50 per cwt in the fourth quarter, yielding an annual average of about $57.29 per cwt.
Little recovery is forecast for 2019, with the full-year average forecast in a range of $54-$62 per cwt (midpoint $58 per cwt).
USDA’s monthly cow slaughter report is scheduled for Dec. 20.
Class I base price starts year with slight uptick
The January 2019 Federal Milk Marketing Order (FMMO) Class I base price is $15.12 per cwt, up 7 cents from December 2018, but 32 cents less than January 2018. The 2018 Class I base average was just $14.84 per cwt, about $1.61 less than 2017 and just 4 cents more than the 2016 average.
Dairy-RP activity tops 10 billion pounds of milk
Participation in the Dairy Revenue Protection (Dairy-RP) program continues to grow. Based on information from the USDA’s Risk Management Agency (RMA) as of Dec. 17, dairy producers have covered revenue on about 10.4 billion pounds of 2019 milk production under the program.
The latest report shows 1,387 dairy producers had filed applications in 34 states. Of the applications, 720 have purchased 1,929 quarterly endorsements.
Based on the latest USDA milk production forecast of 220.9 billion pounds, the percentage of milk covered under Dairy-RP would be about 4.7 percent.
Total premium costs on purchased endorsements were about $32.2 million, with USDA RMA subsidies covering about $13.3 million of that.
Dairy-RP sales covering milk revenue for the first quarter of 2019 closed on Dec. 15. As of Dec. 17, RMA had not provided information for the first quarter of 2020, due to limited activity on the Chicago Mercantile Exchange futures markets.
Dairy-RP policies are not available for sale on days following USDA dairy reports with a potential impact on markets. The agency released its monthly Milk Production report on Dec. 19, followed by the Cold Storage report on Dec. 21. In addition, the Chicago Mercantile Exchange closes early on Dec. 24 and Dec. 31, and is closed for Christmas and New Year’s Day holidays.
LGM-Dairy update
Alan Zepp, risk management program manager at Pennsylvania's Center for Dairy Excellence (CDE), reviewed various options during his monthly “Protecting Your Profits” conference call, Dec. 19. The December sales period for the Livestock Gross Margin for Dairy (LGM-Dairy) is Dec. 28-29.
The LGM-Dairy insurable margin (using a ration similar to the Margin Protection Program-Dairy program) for the next 10-month period averaged about $7.25 per cwt (as of Dec. 19). Cost for coverage for the entire period was estimated at 50 cents per cwt for a zero deductible policy; 12 cents for a $1 deductible policy.
At the close of trading on Dec. 18, the Chicago Mercantile Exchange (CME) Class III futures for the next 12 months averaged $15.81 per cwt; Class IV futures averaged $16.11 per cwt.
The March 2019 CME Class III futures contracts settled at $14.97 per cwt on Dec. 18. An at-the-money put at $15 per cwt would cost 45 cents; a $14 put, reflecting similar risk protection to a $1 deductible LGM-Dairy policy, would cost 12 cents. If purchasing a put option, there will also be a small charge to cover the difference in the bid-ask spread.
Zepp’s next Protecting Your Profits call will be Dec. 19. All calls are recorded and archived.

-
Dave Natzke
- Editor
- Progressive Dairyman
- Email Dave Natzke


