This informal survey is the fourth of its type. Many academics, practitioners and trade journals participated in helping put out the word. Finally, special thanks go to each and every one of the dairy producers who took the time to fill out the survey.
Of the 126 responses, 44 were from the West; 52 from the Midwest; 9 from the Southeast; and 21 from the Northeast. I used the U.S. Department of Agriculture, National Agricultural Statistics Service to determine where states fall in terms of regions.
Milker wages
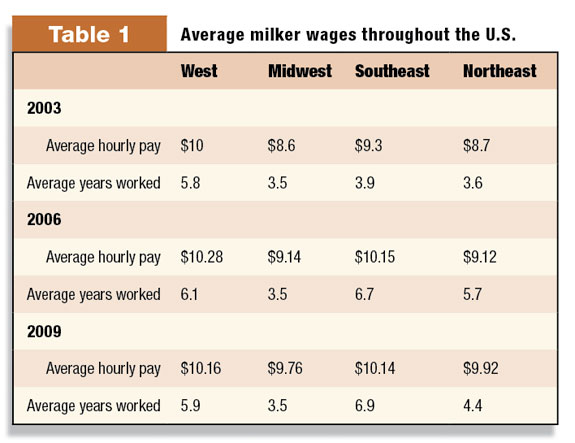
It was up to each dairy farmer to pick one milker, and give us the number of years the person has been employed. Readers should not assume that milkers in one region have longer lengths of employment based on this study. In 2003, I observed that the West paid best, but qualified the results since the West also had the longest reported average length of employment by far. In 2006, we note that as the reported average length of employment for other regions rose, so did the average wage level. In 2009 we continue to see a relationship between length of employment and wages earned. Average milker wages were $9.95 (2009), $9.69 (2006), $9.25 (2003) and $9.26 (2000).
(See Table 1 .)
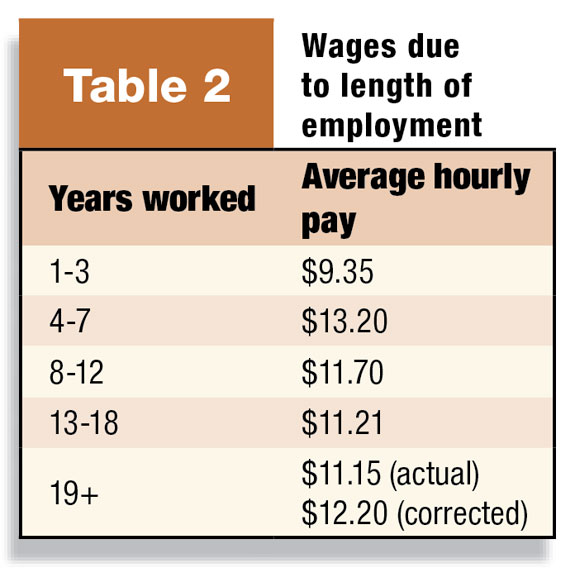
In Table 2 we look at wages in relationship to length of employment. Milkers with longer time on the job tend to make more money. For those employed over 18 years, we had one employee receiving very low wages, and so we report the data with and without that employee. These figures can be a starting point when creating an internal wage structure.
Foreign-born milkers
I have hypothesized that 1) the number of foreign-born milkers will increase through time, especially as Mexican and Central American workers move into regions where they were not utilized in the past; and 2) that as foreign-born milkers increase, the number of USA-born female milkers is likely to decrease.
The average percentage of foreign-born milkers was essentially the same in the 2009 survey (66 percent) and the 2006 survey (69 percent). Given issues of sampling, it is best not to draw too many conclusions as to these numbers. I was probably premature in assuming that the jump in the Northeast from 22 percent (2003) to 43 percent (2006) was real, and not a sampling error, given the 29 percent in 2009. Similarly, it is hard to say if the Southeast truly jumped to 83 percent foreign-born milkers, or if we just have a substantially different sample answering the survey. Places such as California have for a long time had high percentages of foreign-born milkers. The 2009 sample showed only 77 percent foreign-born, in contrast to my 2006 sample (94 percent).
Female milkers
The number of foreign-born milkers is of special interest when contrasted to female milkers. I will continue to be interested in seeing if the number of female milkers goes down as the number of foreign-born milkers goes up. In order to better understand the data, in future years I need to find out how many of the females are foreign-born versus USA- born milkers.
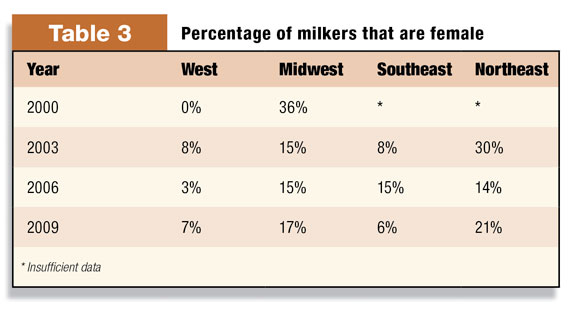
(See Table 3 )
Other data of interest
Forty-seven percent of dairy farmers offered some type of incentive or bonus pay in 2009 (in contrast to 36.5 percent in 2006). Bonuses may include any sort of benefit, such as beef, money or time off, which is not directly related to an individual’s work efforts. Incentives, on the other hand, are tied directly to worker performance.
In these times of such economic stress, a well-designed incentive pay program can be of great benefit to dairy farmers and their employees. A well-designed incentive – such as pay tied to lowered somatic cell counts or increased calf health – means employees only get an incentive if they have helped to increase the profitability of the dairy.
In this study, for the month of May 2009, about four out of five of those eligible for an incentive earned one. The average monetary value for those earning an incentive was $142 for the month. Beside the more traditional incentive programs, one dairy producer rewarded hard- working youth at his operation with educational scholarships.
One-fourth of employees (2009) received some sort of health insurance, down from one-third who received health insurance in 2006. The average cost for this insurance for the dairy producer was $341 per month in 2009 versus $377 in 2006. Sixty-three percent of dairy producers provided paid vacation to their milkers. These milkers earned an average of nine days of vacation in 2009, compared to 10 days in 2006. A few dairymen also offered additional pay in lieu of vacation.
Forty percent (2009) of the dairies supplied milkers with housing or a housing allowance. In 2006, half of the dairies reported providing this benefit. The housing allowance averaged $239 per month. Seventeen percent paid a shift differential for more difficult shifts. Eighteen percent (2009) of dairy producers offered a 401k or some sort of retirement plan for their employees.
Labor supply outlook
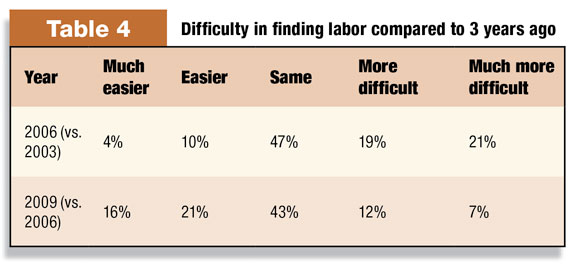
In 2006, I began asking dairy farmers about the tightness of the labor supply. In Table 4 , we see that dairy farmers in 2009 had a much greater availability of labor than three years earlier.
As in previous surveys, some dairy farmers did not know where a replacement worker might come from, while others had no problem in recruiting. One dairy producer explained that potential employees showed up without any need for recruitment. Much can be said about building a reputation for being a solid employer. Pay is normally a very important factor in attracting and retaining employees, but interestingly, a dairy with no labor supply needs was paying only a dollar more ($11, Kansas) than a couple of dairies who had trouble finding employees ($10, Washington, Ohio).
With the growing uncertainty regarding labor supply in the future, there are important steps that dairy farmers can take that will help them attract and retain productive employees. Without minimizing the effect of external factors, there are specific steps that dairy producers can take to become more attractive to potential future applicants. PD
References omitted but are available upon request at [email protected]

-
Gregorio Billikopf
- University of California
- Email Gregorio Billikopf

