We’ve all heard it said, “The proof is in the pudding.” However, the pudding we’re talking about in this article is no dessert fare. It’s actually the final byproduct of rumen and lower tract digestion. And while the absolute proof may not lie in the pudding, it certainly carries some strong evidence regarding starch digestibility.
Fecal starch analysis has been available for some time, but up to now, the interpretation of those results has been difficult. Recently, Dr. James Ferguson from the University of Pennsylvania has developed a formula that directly relates the results of fecal starch analysis to total tract starch digestibility.
According to Ferguson’s formula, 5 percent fecal starch content relates to at least 90 percent total tract starch digestion. A reasonable goal for high-group lactating dairy cows is 5 percent fecal starch or less. Optimally, 2 percent to 3 percent would be desirable.
In addition, Ferguson calculates that for each 1 percent of fecal starch over 5 percent, dairy producers are losing .72 pounds of milk production. A herd yielding manure with 15 percent starch, which is high but not entirely uncommon, would be losing 7.2 pounds of milk production.
What has been the range of fecal starch results since this formula was developed? According to Cumberland Valley Analytical Services in Maryland, approximately 38 percent of the samples they have processed are greater than 5 percent fecal starch.
Very recent results from a group of dairy nutritionists in southwest Wisconsin report a range of .70 percent as a low to 15.25 percent as a high.
Factors affecting fecal starch
There are a variety of factors that affect fecal starch levels and may include feedstuff moisture and maturity, the processing of grains, the distribution and variation of TMR particle length, varietal differences, prolamin levels of the corn in grain and corn silage and other factors.
Two of the most observable and measurable factors affecting fecal starch are corn silage processing and time in storage.
During late summer and fall 2010, a group of dairy nutritionists in southwest Wisconsin were involved in a project to determine the relationship between corn silage processing and fecal starch in the manure of high-group lactating dairy cows.
With Ferguson’s findings and formula in mind, the group sought to quantitatively determine what, if any, relationship exists between corn silage processing and fecal starch.
The procedure for the evaluation was to simultaneously sample corn silage and high-group manure. The corn silage sample was taken in the usual manner, while the manure was sampled by walking the pens and gathering golf-ball-sized samples from 10 to 15 fresh and undisturbed “pies.”
Both samples were sent to Dairyland Labs in Arcadia, Wisconsin. The corn silage was evaluated with Dairyland’s Corn Silage Processing Score (CSPS) analysis that measures the amount of starch passing through a 4.75mm screen.
The manure was simply analyzed for fecal starch content expressed as percentage of dry matter in the sample. Again, the goal here is to find less than 5 percent starch in the manure, with 2 percent to 3 percent being optimal.
The surveyed herds were largely from southwest Wisconsin, though there were a few from western Iowa, Pennsylvania, New York and Texas. 10 representative observations are shown for 2009 corn silage and 10 for 2010 corn silage.
Most of the sampling took place from late September to late November 2010. The two crops were separated to offer a fairer and more accurate comparison between farms. It appears that time in storage has a profound affect on the resulting fecal starch, so the two results are segregated between 2009 corn silage held in storage for more than eight months and 2010 corn silage held in storage for less than four months.

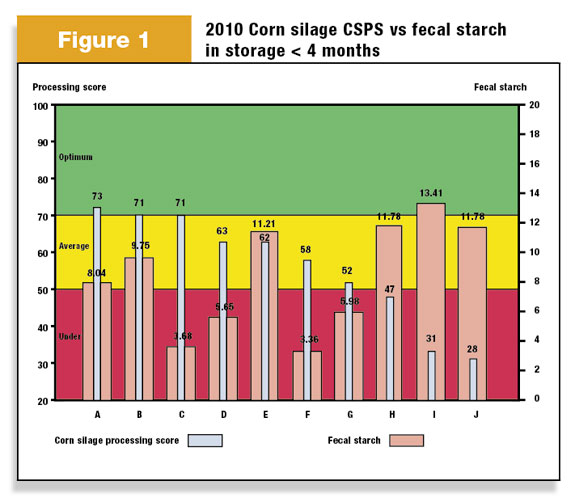
Corn silage processing scores (CSPS) were plotted along with each farm’s fecal starch result. The data is arranged with the highest CSPS on the left to the lowest on the right. See Figure 1 .
2009 CSPS versus fecal starch
Let’s take a closer look at these 10 observations from 2009 corn silage. The average CSPS for these 10 farms was 61.9, while the average fecal starch was 2.96 percent. Looking at fecal starch alone, these are very good results.
Remember, the goal is 5 percent fecal starch or less, with 2 percent to 3 percent being ideal. For the most part, these goals were achieved regardless of CSPS. With a couple of exceptions, the fecal starch line is fairly level compared to the CSPS line.
Taking a closer look, though, shows that the top five farms had an average CSPS of 68.2 and average fecal starch of 2.38 percent. The bottom five farms averaged CSPS 55.6 and a 3.55 percent fecal starch. Still very good fecal starch numbers, but somewhat higher than the top five farms.
The lack of variation in these fecal starch results was at first a little puzzling, until time in storage was considered. With the exception of Farm A, which was sampled in May of 2010, all others were sampled in early fall and had been in storage 11 to 14 months.
The corn silage from these 10 farms averaged 12.2 months in storage. It is well known that time in storage affects starch digestibility. More about that later.
What about moisture differences? Generally, wetter corn silage results in higher and faster starch digestibility. Once again, high moisture was a common trait of almost all these corn silages. The ten samples averaged 32.7 percent DM, with the wettest running 28.7 percent DM.

2010 CSPS versus fecal starch
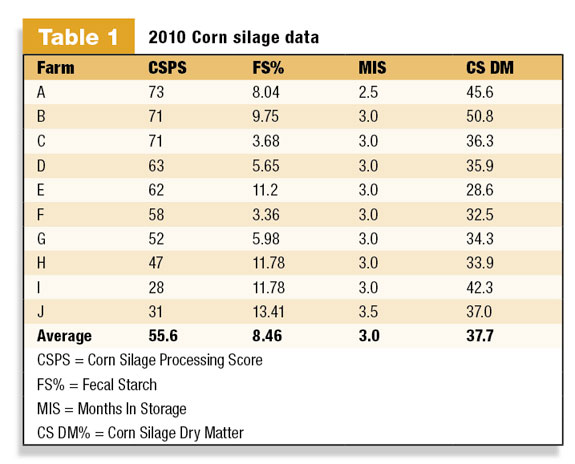
What a difference a year makes! Or at least a change in crop and time in storage (see Table 1 ). These 10 farms (not necessarily the same farms that were in the 2009 data) averaged CSPS of 55.6, while the average fecal starch was 8.46 percent (2009 was 61.9 and 2.96 percent respectively).
The top five farms averaged CSPS of 68 and fecal starch of 7.66 percent. The bottom five averaged 43.2 CSPS and 9.26 percent fecal starch.
It’s clear that these fecal starch results are affecting production and if we apply Ferguson’s formula of .72 pounds of milk for every 1 percent fecal starch over 5 percent, we can see that these 10 farms are missing about 2.5 pounds of milk. Farms E, H, I and J are potentially missing over five pounds.
While there exists a tendency for lower fecal starch with better processing, it’s difficult to attribute all of this high fecal starch to poorer corn silage processing in 2010, because the high fecal starch results seem to be more random.
For example, farms A, B and E all had excellent processing scores but elevated fecal starch. On the average, these 10 farms from 2010 produced corn silage that was five points drier than the data gathered for 2009.
Farm A with the highest CSPS, but with an elevated fecal starch level, was feeding the driest corn silage at 45.6 percent DM, so moisture could be a factor there. Time in storage on all these farms was rather short and fairly similar, with the minimum of 2.5 months and the maximum of four months.
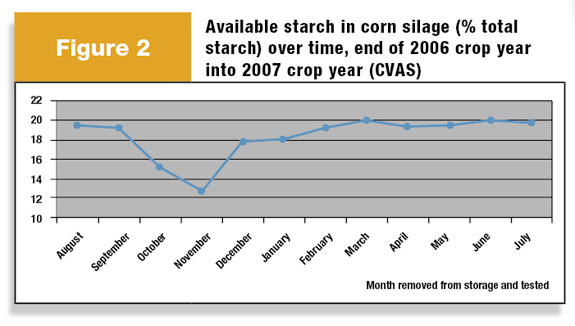
Undoubtedly, time in storage is responsible for a large part of these results. This is not new information to dairy nutritionists, but this data may go a long way to demonstrate the magnitude of the issues involved in short-time storage.

Figure 2 from Cumberland Valley Analytical Services shows the availability of starch from corn silage over time in storage. According to Cumberland’s results, it takes until March to get to maximum digestibility.
Summary and recommendations
While the results of this survey do suggest that proper corn silage processing will often result in lower fecal starch levels, a poor job of corn silage processing will almost guarantee higher fecal starch levels.
The relationship is not always clear-cut because there are so many factors affecting starch digestibility and the resulting fecal starch level. Most importantly, time in storage consistently and dramatically seems to influence resulting fecal starch.
What can be done to deal with or prevent starch availability-related problems? Rod Martin, dairy technical specialist with Vita Plus, has four recommendations:
Producers should make it a goal to increase corn silage inventories so they have a carryover into January or February of the following year, when starch digestibility is finally approaching maximum. Because of storage limitations, this may not be immediately achievable but should become a long-term goal.
Producers may want to consider feeding lower levels of corn silage during the fall when starch digestibility is at its lowest and replace it with high-quality haylage. The key, according to Martin, is that the haylage needs to be of very high quality. By January or February, normal corn silage levels can be resumed.
Adding very highly digestible byproducts such as soy hulls or whey byproducts can also help compensate for lower starch availability. A secondary benefit of feeding byproducts may be that ration cost might be reduced.
When higher-than-desired levels of fecal starch are measured, producers should re-evaluate the micron size of the corn grain being fed. This can help break up the prolamin layer and release more floury endosperm (starch) found in mature corn kernels. PD

-
Jon Urness
- National Forage Specialist
- Vita Plus Corporation
- Email Jon Urness


