Harvested area of all hay is expected to increase or hold steady in most southern and western states. Most significant declines are expected in the Northern Plains states. A record low for all hay harvested area is expected in Illinois, Iowa, New York and Rhode Island.
Precipitation and irrigation water supplies in western states are much closer to normal this year compared with recent years. This has encouraged producers to utilize more hay ground.
Alfalfa and alfalfa mixture hay harvested area was estimated at 18.1 million acres, up 2 percent from the 17.8 million acres harvested in 2015. Largest acreage increases are expected in Wisconsin (+100,000 acres), Idaho (+90,000) and California (+80,000).
Harvested area for other hay was estimated at 38.1 million acres, up 4 percent from the 36.7 million acres harvested in 2015. Largest acreage increases are anticipated in Missouri (+500,000 acres), Texas (+400,000) and Pennsylvania (+210,000).
Download USDA’s acreage report (PDF, 739KB).
USDA’s latest World Agricultural Outlook Board report provided an update on soil moisture conditions in major and minor hay-producing areas of the U.S. As of June 28, about 12 percent of U.S. hay acreage was in areas experiencing drought. California, western Arizona, Nevada and eastern Oregon remain the areas of extreme drought, with hay-producing pockets in South Dakota, southeastern Iowa and several states in the Southeast and New England now experiencing drought.
Check out the hay areas under drought conditions (PDF, 3.9MB).
May hay prices lower
Alfalfa and other hay price changes were mostly lower in May, according to the USDA National Ag Statistics Service’s (NASS) monthly ag prices report, released June 29.
Alfalfa
The May 2016 U.S. average price paid to alfalfa hay producers at the farm level was $147 per ton, down $6 from April and $45 less than a year earlier.
Compared with a month earlier, average prices were up $35 per ton in Nevada, but $15 to $25 per ton lower in Arizona, Colorado, Oregon and Utah.
Several states saw average prices down $40 to $60 per ton compared with May 2015, including Arizona, California, Michigan, Minnesota, Nevada, New Mexico, New York, Oklahoma, Oregon, Pennsylvania, Utah, Washington and Wisconsin.
Only Kentucky and New York reported average prices higher than $200 per ton in May 2016. Lowest reported alfalfa hay prices in May were in North Dakota ($70 per ton) and Nebraska and Wisconsin ($90 per ton).
Other hay
The U.S. average price for other hay was down $8 per ton from April, to $122 per ton in May.
Compared with a month earlier, California and Oregon posted increases of $10 per ton, while Michigan, Ohio, Utah and Wisconsin saw declines of $12 to $15 per ton.
Compared with a year earlier, other hay prices were down $40 to $60 per ton in Arizona, Michigan, Nevada, Pennsylvania and Utah.

April U.S. alfalfa hay exports maintain strength
U.S. alfalfa hay exports were down in April, but still tipped the scales at more than 190,000 metric tons for a second consecutive month, according to USDA’s Foreign Ag Service.
April 2016 alfalfa hay exports were estimated at 192,143 metric tons, down from the March total of 199,809 metric tons, but up slightly from April 2015.
China, which is building its domestic dairy herd, was the only country to increase alfalfa and other hay shipments from the U.S. compared with March, noted Christy Mastin, international sales manager with Eckenberg Farms Inc., Mattawa, Washington. However, shipments to China were less than April 2015.
Read April U.S. alfalfa hay exports maintain strength
Dairy outlook: Hitting the slow road to recovery
Signs of optimism began to peek through dairy’s economic picture as June ended. Nationally, cow numbers were steady, but milk output per cow improved. However, hot weather was putting a damper on milk output per cow in many areas, helping cap supply.
Based on USDA’s monthly milk production report, regional production storylines were essentially the same. Milk production was down in the Southwest and Southeast, but stronger in the Northeast and Midwest.
What’s different was the milk price outlook. Although signs of improvement dimmed a little on the final Chicago Mercantile Exchange (CME) trading day of June, prices still ended the month well above where they began. August-December 2016 CME Class III milk prices futures averaged $16.26 per hundredweight on June 30, compared with $14.56 per hundredweight on May 31.
“We’ve already hit the bottom,” said Mark Stephenson, director of dairy policy analysis at the University of Wisconsin – Madison. “We’re on our way up. The question is whether we’re going to take the 2-dollar jump or more the futures market shows, or if it will be a little softer than that.”
“I don’t expect the recovery to be explosive,” he said. “Prices will start to creep up to more comfortable levels, but it’s going to take awhile before we feel like we’ve had a full-blown recovery.”
Make no mistake, the May dairy economic picture was ugly. At $14.50 per hundredweight, the May 2016 milk price continued to slide, down $.50 from April. In contrast, feed costs averaged $8.73 per hundredweight for the month, up $.56 per hundredweight.
Feed costs were pushed higher by a $73 per ton jump in soybean meal (to $376 per ton) and a $.10 per bushel increase in the corn price (to $3.68 per bushel), offsetting the $6 decline for alfalfa hay (to $147 per ton).
Beef outlook: Cattle on feed up 2 percent
Cattle and calves on feed in U.S. feedlots with capacity of 1,000 or more head totaled 10.8 million head on June 1, up about 2 percent compared with a year earlier.
At 7.06 million head, Kansas, Nebraska and Texas feedlots held nearly 65 percent of the U.S. total, according to USDA’s Cattle on Feed report, released June 24.
May placements totaled 1.88 million head (1.81 million net), up 10 percent from a year earlier.
May fed cattle marketings totaled 1.79 million head, 5 percent more than May 2015.
Figures and charts
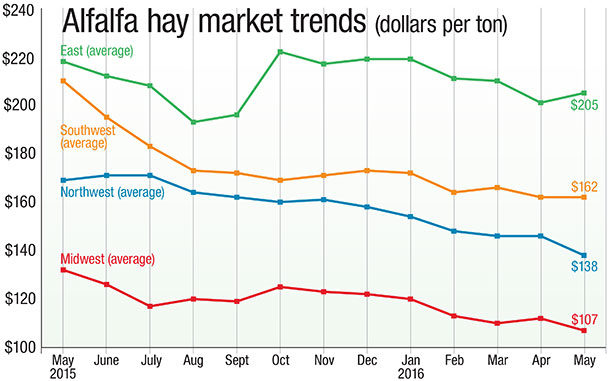
The prices and information in Figure 1 (alfalfa hay market trends) and Figure 2 (“other hay” market trends) are provided by NASS and reflect general price trends and movements. Hay quality, however, was not provided in the NASS reports.
For purposes of this report, states that provided data to NASS were divided into the following regions:
Southwest – Arizona, California, Nevada, New Mexico, Oklahoma, Texas
East – Kentucky, New York, Ohio, Pennsylvania
Northwest – Colorado, Idaho, Montana, Oregon, Utah, Washington, Wyoming
Midwest – Illinois, Iowa, Kansas, Michigan, Minnesota, Missouri, Nebraska, North Dakota, South Dakota, Wisconsin ![]()

-
Dave Natzke
- Editor
- Progressive Forage
- Email Dave Natzke
