The University of Idaho Extension produces costs and returns estimates for alfalfa hay every other year. The overall goal of this project is to provide hay producers with an unbiased and consistently calculated estimate of the costs to produce alfalfa hay and to track the change in production costs per acre and per ton over time. In this article, we’ll explain how costs and returns estimates are constructed and discuss four ways they can be used to improve your management system and profitability.
Budget background and format
Costs and returns estimates are based on economic costs, not just accounting costs. Resources are valued at a fair market rate or “opportunity cost.” Production practices are based on data from farmers, crop consultants and extension personnel throughout Idaho. Although production practices may be similar for individual farms, each farm has a unique set of resources with different levels of productivity, different production problems and therefore different costs.
Farm size, crop rotation, age and type of equipment, and the quality and intensity of management are all crucial factors that influence costs. The template illustrated here is divided into three sections (gross returns, operating inputs and ownership costs) and can easily be adapted to your specific farm in any part of the country. See the website link at the end of the article for more information.
The model farm
The model farm for this cost and returns estimate is a 1,250-acre farm with 1,000 acres in alfalfa hay and 250 acres in small grains or corn. The alfalfa stand is kept in production four years, including the establishment year. Approximately 250 acres of alfalfa are established every year.
In general, operating costs are not influenced by farm size. However, ownership costs do change with farm size, primarily because of economies of size and scale with equipment. Equipment ownership costs per acre are strongly influenced by the number of acres over which these costs are spread. The more acres you cover, the lower the cost. In establishing the farm size and selecting the machinery complement, we attempt to achieve an economically efficient combination. Equipment that is under-utilized has high ownership costs, while equipment with too many hours of use results in unrealistically low ownership costs.
Production practices
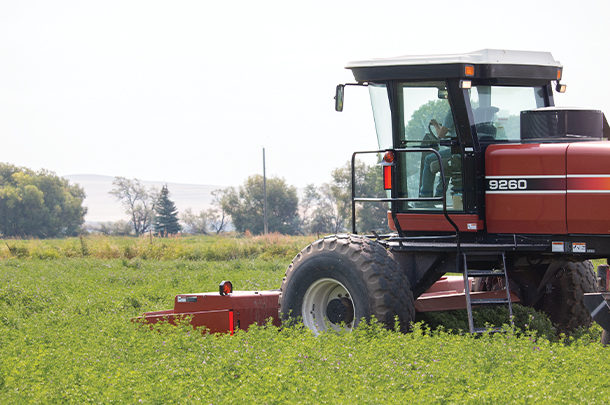
Fertilizer, impregnated with herbicide, is custom applied each spring, and an insecticide is applied by air in July. More than one insecticide application may be necessary in some years, however. Alfalfa is harvested three times: June, August and September. The costs of all harvest operations are based on rates charged by a custom operator who swaths, rakes, bales and stacks the hay in 1-ton bales. If you own your equipment and harvest your own hay, calculating these costs can be a little tricky, but they should be close to or below your local custom harvest rates.
Alfalfa receives 28 inches of water during the growing season: 3 inches in May, 7 inches in June, 7 inches in July, 7 inches in August and 4 inches in September. The farm uses a center-pivot irrigation system and surface water delivered to the farm from an irrigation district. The irrigation district charges a flat fee per acre for water. Irrigation power use is based only on pressurization (no lift).
There are no tillage costs or seeding costs during the full production years of the alfalfa stand. However, a prorated share of the cost of establishing the alfalfa stand is included as a non-cost ownership cost. This cost would range between $55 and $85 per acre, assuming establishment costs between $200 and $300 per acre, a four-year stand life and an interest rate of 6%.
Yields and prices
Yield and price estimates are used to calculate gross revenue and breakevens for different categories. We typically use a three-year average yield and price estimate to be conservative, but producers can easily plug in price and yield projections for their own farm.
Machinery
Machinery ownership cost (capital recovery) is based on 75% of the replacement cost of a new piece of equipment, except for trucks. Capital recovery combines depreciation and interest into a single value and is calculated as a cost per acre.
Labor and management
The cost of labor includes a base wage, plus a percentage to account for various payroll taxes (FICA, SUTA and FUTA) and workman’s compensation, as well as benefits such as paid vacation/personal leave days, health insurance and bonuses. Labor is classified by the type of work performed. A management fee based on approximately 5% of the total production costs is also included.
Capital, land and overhead costs
Interest on operating capital is charged from the time an input is applied until harvest and is calculated at a nominal rate of 7%. Interest on intermediate-term capital, primarily equipment, is calculated using a nominal rate of 6.75%. A general overhead charge, calculated at approximately 2.5% of operating expenses, is included to cover unallocated whole-farm costs such as office expenses, legal and accounting fees, cellphones, internet service and utilities. Irrigation power is not included as part of general farm utilities.
Land rent is based on a multiyear cash lease for hay and covers the ownership costs (depreciation, interest and insurance) of the irrigation system. Because the charge for water, irrigation system repairs and irrigation power costs are listed separately, the land rent may appear low because the landowner in many circumstances pays some or even all of these expenses.
Costs and returns estimate
Table 1 shows the estimated gross returns and expenses for this model farm.
![Alfalfa hay [Eastern Idaho: Irrigated - 2019]](/ext/resources/PF/images/stories/2020/10/22/1020pf-eborn-tb1-preview.jpg)
- Gross returns are $960 per acre (6 tons X $160 per ton).
- Operating expenses (direct or variable) vary with the level of production and involve inputs used in a single production cycle. Operating inputs are organized by category. In this example, the operating expenses total $456.40 per acre or $76.07 per ton. The break-even price to cover operating costs is $76 per ton.
- Ownership expenses (indirect or fixed) include a systematic cost recovery for inputs used in the production process that have a useful life of more than one year. Machinery and land fall into this category. The ownership expenses are an additional $340.36 per acre or $56.73 per ton.
- Combining operating and ownership costs gives the total cost of production. In this example, the result is $796.76 per acre or $132.79 per ton. The break-even price to cover all economic costs is $133 per ton.
Summary
Costs and returns estimates can be used as management tools to help producers in four ways:
- Templates. Excel spreadsheets have been created by the University of Idaho to make enterprise budgeting and record-keeping an easy task. You can start by substituting our costs and returns estimates with your own numbers. The format is user-friendly and easily adaptable to other regions of the country.
- Marketing. Estimating production costs on a per-acre and per-ton basis can help you calculate your farm’s break-even prices. Knowing your break-even price needed to cover operating costs and total costs can help with contract negotiations and selling hay on the open market.
- Benchmarks. The University of Idaho costs and returns estimates are based on a typical or model farm and are calculated every other year using consistent methodology. You can use these estimates as benchmarks by comparing your own total costs or specific cost categories to our estimates. This is a good way to find strengths and weaknesses in your production practices.
- Sensitivity analysis. A break-even sensitivity analysis, as shown in Table 2, can help you assess price and yield risk. Estimated prices and yields can be adjusted to determine the impact on operating, ownership and total cost break-even prices and yields.

Average is not profitable. It’s important to remember: Just because your production costs may be similar to our estimates, that isn’t necessarily a good thing. Our model farms are typically unprofitable. Average producers usually don’t make an economic profit (which includes opportunity costs and non-cash costs such as depreciation). Being profitable requires fine-tuned management and a competitive advantage the average producer doesn’t have.
More detailed University of Idaho costs and returns estimates for many other crop and livestock enterprises can be found on the Idaho AgBiz website. They can be downloaded in PDF format and in Excel spreadsheets.


