Big data is used everywhere in our lives, whether it be on our fitness tracking devices or suggesting shopping items on our screens. Increasingly, big data is also part of our farms. The number of cows along with the variables that go in and out of a farm each day make dairy farms an ideal data generation center, but how we collect, manage and use this big data determines its ultimate value.

What is big data? There is no one singular definition; however, it typically refers to large structured, semi-structured or unstructured datasets. This information can be mined for information, used to track trends, develop advanced algorithms or utilized in a multitude of other advanced analytic applications.
The idea of big data can be intimidating. Once we collect all the data, how do we go about using it? Big data is extremely useful because it helps paint a picture of what is really happening on farms. In a sense, it’s like a paint-by-number. Each data point we collect is a number that must be filled in. As we receive data from each point, the picture becomes clearer, and the more numbers the painting is made up of, the more detailed our completed picture is.
A critical step in taking on big data is ensuring the data collected are correct so that the decisions based on this data are also correct. Going back to the paint-by-number, if the paint we use to fill in a numbered area does not match the specified color in the key, our painting will look nothing like it is supposed to and may leave the observer confused. This is also true with our data. If incorrect information is entered, or the key does not match up, this can lead us to make wrong assumptions about what the data are telling us.
On-farm, the key likens to data labeling. Incorrectly labeled data won't be associated with similar data, leaving holes or gaps in our painting, or data may be attributed to another source – muddling the picture altogether. Taking advantage of technology can help to decrease the risk of human errors by automating as many processes as possible.
Once we have a goal for a clean dataset, there must be a clear plan laid out to collect the data. What are key identifying factors that can be associated with each dataset to enable them to be joined with other datasets? For example, in a paint-by-number, one number is always associated with one color. On a farm, our cow number can be one clear identifying key.
Minimizing data loss is also a critical step that requires proper planning. What happens when data loggers fall off; who is tracking this, and who handles replacing them? What time frame should this happen within, and who is accountable for making it happen?
For feed samples, who should be collecting these, and are they trained on how to properly sample so the information returned is correct? What days should samples be collected, and is the frequency of sampling aligned with the goals on how the data should be used?
These are all questions and conversations that need to be had among the management and decision-making teams on farms to ensure there is a plan in place for the technologies that yield big datasets. Although it may sound complicated, it can be as easy as implementing a milking parlor preparation routine.
Once we have the correct key to fill in our paint-by-number, and the paint to create the picture, we can start to fill in all the spaces to develop a clear picture and understand what our data are telling us. The more observations or numbers that are present, the more detailed the picture will be. In addition, more observations also help create a more robust dataset.
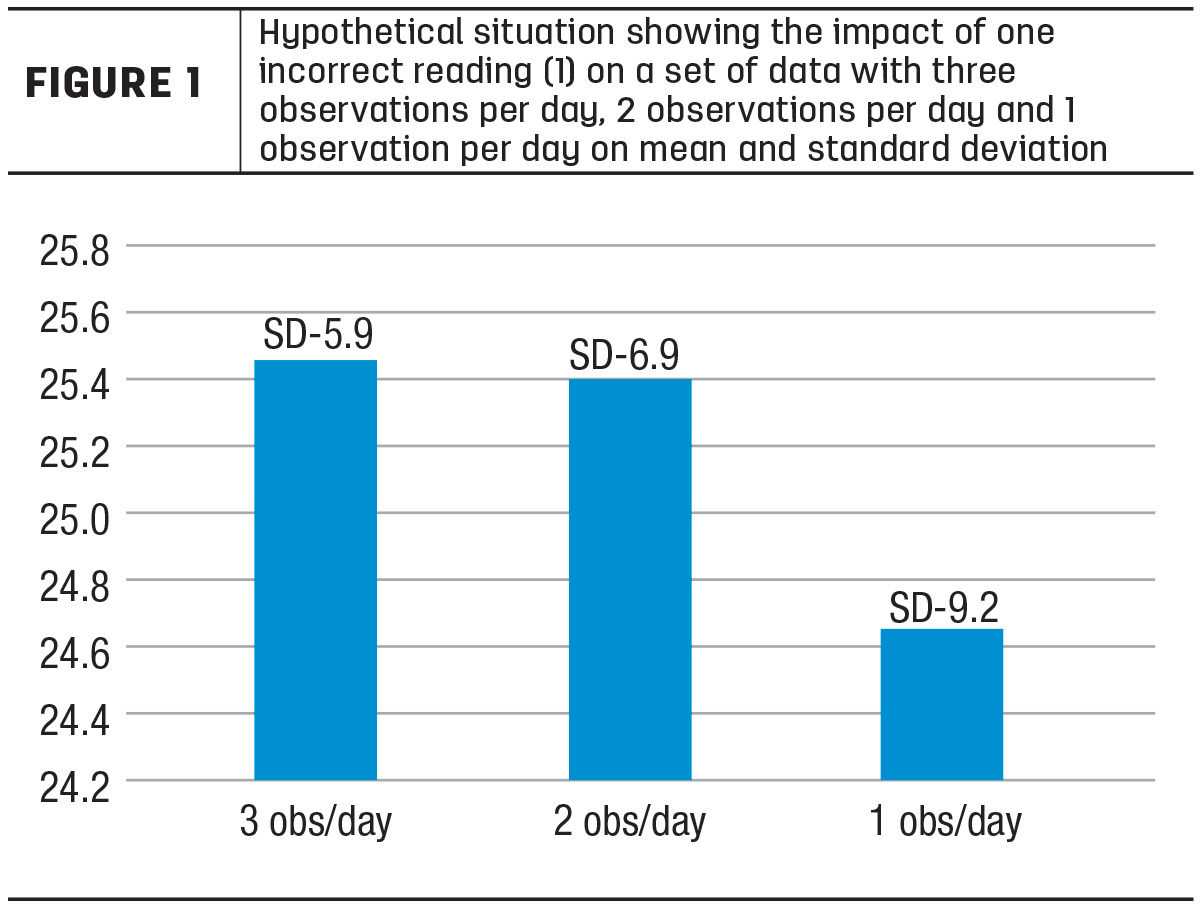
For example, a wrong observation in a detailed paint-by-number may have less of an effect on the outcome than one with fewer numbers or blanks. Similarly, if one day our milk meter reads a cow's milk production value incorrectly as 1 pound of milk for one milking, but we have all other data points correct for the lactation, this is less likely to have an impact on her average than if we only have one correct reading per day or week.
This is demonstrated in Figure 1. As the number of observations decrease, the standard deviation (SD) of a missing observation or incorrect observation also has a much greater impact. This concept applies to all the data we collect on farms, whether they be feed analysis, feed mixing, reproduction, production or health-related; the more observations we have, the more robust the data becomes to incorrect, outlier or missed observations.
One thing that was reiterated to me when in graduate school, and has become an increasingly common conversation, is keeping in mind what goals we want to achieve with the dataset. Once we identify these goals, then a data table can be constructed around these questions, while also being built in such a way that it can be used to help answer future questions and grow year to year. Just as knowing what we are painting will help us along the way, knowing our end goal with data will also do the same.
As clean datasets grow day by day or year by year, they become more valuable and can help us answer larger questions. However, they must be developed purposefully and cleanly to help us do so. When all the technologies on a farm begin to interact with each other, or at least their underlying data frames, the scale of the questions we can answer also grows.
Although data may never replace the value of our boots on the ground, they can help guide decisions and increase the rate at which improvements happen, enabling farms to also increase profitability at a faster rate.