Warren Buffet is quoted as saying, “You need cash. Cash is like oxygen. When you don’t need it, you don’t notice it. When you do need it, it’s the only thing you think about.”
Today, many in the dairy sector are feeling and living those words. Experiencing a shortage of cash and decreasing working capital has become more commonplace in the last several years.
In fact, based on the Compeer Dairy Consulting Benchmark, which accounts for 80,000 cows, the average capital cost per hundredweight – a measure of depreciation, interest and leases – rose from $2.38 to $2.63 in 2016 after remaining steady the previous two years. Much of this increase is attributed to additional borrowing to fund cash needs, subsequently boosting interest expense.
Through the use of dashboards, producers can better anticipate their cash flows. Similar to the dashboard in your vehicle displaying your speed, monitoring the fuel level and even telling you when you need your next oil change, a treasury or cash dashboard can aid in monitoring your cash needs.
Having the ability to quickly assess your business’s cash position – specifically, cash management – and truly understanding your cash obligations is critical to managing your daily business functions.
Many companies and service providers offer dashboard software packages that incorporate these statistics and other metrics, but you don’t have to be fancy or spend a lot of money to leverage a cash dashboard. All it takes to create your own dashboard is a simple spreadsheet with some key items.
Create your own dashboard
Consider the following items to use in your dashboard:
1. The first entry to record on a regular basis is your checkbook balance. This is dependent on balancing your checkbook and having an accurate balance in your accounting software. Set up a schedule to input that balance on a weekly or monthly basis. Over time, you will be able to analyze trends and address deficiency levels.
It is important to target a base dollar amount that triggers a need to seek additional financing for short-term cash availability. It is also important to consider the impact your checkbook balance has on your business. What areas of your business require the most cash?
Do specific line-item cash outflows appear to be proportional on a monthly basis, or do monthly cash needs fluctuate? Are you able to meet all your bill payments and expenses from your checkbook reserves rather than through an operating loan?
Doing this on a regular basis allows you to better manage your cash flow and, if you aren’t cash-flowing, know how much you actually need on a monthly basis to balance your cash requirements.
2. The second item to monitor is your operating loan balance and loan fund availability. Determine not just what the balance is today, but also how much you have available in the coming months. For example, having an operating loan at a balance of $250,000 with a peak of $300,000 lets you know there is $50,000 available to cover short-term needs.
Visiting with your lender about the position of your operating loan and your cash needs going forward is essential. Your lender will be looking to you for as much guidance in what you need as you will be looking to them for help. Operating loans are designed for a short-term repayment plan. Any excess cash should be applied to your operating line for balance reduction and lowering interest expense.
It is important your money is working for you. Creating a dashboard will help you identify whether the operating loan amount is appropriate for your business over the coming year. However, it could also show debt will need to be re-evaluated or an action on cost containment is needed to improve cash flows.
3. Payables and receivables: How do you pay your bills? Do you pay bills as they come in, or do you assess when bills are due and evaluate the timing of payments? Typically, most vendors – but not all – allow for 30-day payables. Keeping track of those that may have built up over time is imperative. Be sure to record who you owe, the amount you owe them and payment due dates.
Breaking down payables in categories of days past due (i.e., 30 days, 60-plus days) will help you manage which bills to pay first. Utilizing bill reminders in your accounting software can also help you manage the timing of expenses. This will allow you to consider finance charges associated with past due bills and limit your exposure to high interest rates and late charges.
Additionally, you can track potential receivables – including milk receivables or custom hire income – that will enable you to cover your payables.
4. Working capital and working capital burn rate: Losing working capital can happen extremely quickly. Many producers have experienced this in recent years, but it is important to stay focused on achieving a working capital level of $400 to $600 per cow. Maintaining at least one year of working capital burn rate is valuable for creating flexibility and fulfilling needs.
For example, your dairy is losing $20,000 a month and is projected to lose $250,000 over a year. If you have $1.25 million in current assets and $1 million in current liabilities, you have $250,000 of working capital. With this information, you only have about one year of working capital reserve to get you through.
Go further yet and evaluate the amount of your current assets that is truly liquid, meaning readily available cash value (cash, milk receivable, market livestock and cash grain to be sold). You may notice your liquid amount is only $700,000. This would raise immediate red flags in managing working capital because you do not have enough convertible cash to cover short-term needs.
5. Finally, take a look at non-monthly, seasonal types of expenses, both incoming and outgoing. These can really impact your cash flow. On the positive side, maybe you’re going to sell some soybeans in the next couple of weeks, or you’re expecting an insurance payment.
These types of receivables can bring in a lot of cash. On the other side of the ledger, perhaps a large custom operating bill or manure-hauling invoice comes due, or it’s time to pay your year-end cash land rents. Recording cash inflows and outflows will help you cross-check with your checkbook and operating loan availability to give you a solid picture of your financial position at any given time.
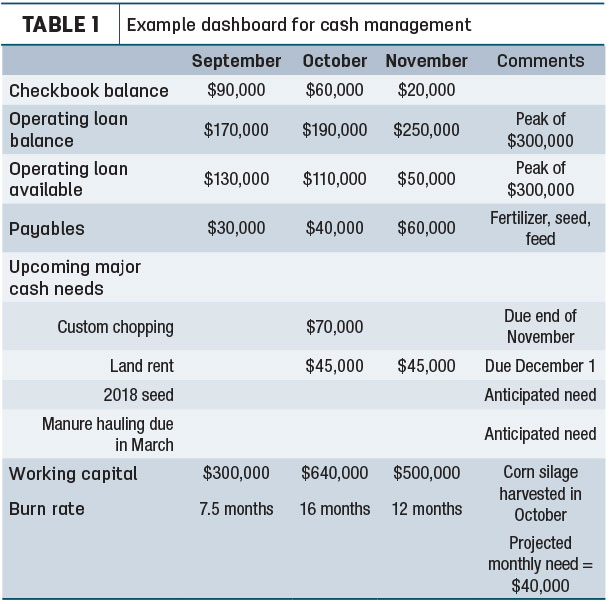
Using the sample in Table 1, what analysis can you draw from this dashboard?

- Cash is being depleted by $23,000 per month, plus increased payables of $10,000 per month, for a total of $33,000. This producer estimates there is $7,000 of additional cash needs per month, totaling $40,000.
- This producer has $45,000 due for land rent in December, along with another anticipated $33,000 needed for cash shortfall, for a total of $88,000. However, there is only $50,000 available on the operating line and $20,000 in cash.
- While burn rate is at 12 months in November, the current cash position doesn’t allow even a month’s liquidity. Most of the working capital is in the form of feed.
- It is important to find out how much this producer will need for 2018 seed, in addition to manure-hauling costs due in March, so he will be able to understand both his cash needs in the next couple of months as well as going into 2018.
Consistent, reliable information, continuous monitoring and taking action is essential to the success of any business. Sit down with your ownership and management team, accountant or bookkeeper to create and customize a dashboard that works for you.
Don’t wait until the “check engine” light comes on to deal with cash issues in your business. Even if the check engine light has come on, take action now. Use the dashboard as a tool for understanding your cash needs, increasing effective communication with your management team and as a resource when working with your lender.


