To read this article in French, click here.

You have just spent several hours with your advisers improving your reproductive plan. Perhaps you have changed your voluntary waiting period. Or maybe activity monitors are now being utilized to detect heat. Regardless of your type of plan, why do we wait for pregnancy check day to evaluate reproductive data? Lagging indicators – such as conception risk – play a significant role in reproductive analysis. However, an immediately actionable analysis is one that assesses compliance to the reproductive plan.
There are many aspects to assessing compliance. For farms using synchronization programs, are all cows receiving the right dose of the right drug at the right time? When breeding on estrus detection, what percentage of cows are not detected in estrus and what is being done to identify and breed those cows? Regardless of the reproductive plan, one of the most important areas to assess is whether cows were inseminated at the intended time. How might you go about doing so?
Step 1: Plot DIM at first insemination
A good place to start utilizing data to evaluate compliance to the insemination plan is by graphically displaying days in milk (DIM) at time of insemination. This commonly used graphic can be used to evaluate:
- Adherence to the voluntary waiting period
- Range of DIM over which cows are inseminated for first service and subsequent services
- Interval between services
In Figure 1, each dot represents the DIM at first service for each cow with a breeding event within the time frame. Two different example farms are shown to illustrate interpretation of these data. These farms were selected as examples for discussion because they have very similar, highly successful reproductive outcomes but very different reproductive plans. Clearly establishing the reproductive plan is critical for effective evaluation and data-driven management of reproduction.

Step 2: Evaluate adherence to the voluntary waiting period
The planned voluntary waiting period for Farm A is 60 DIM, and for Farm B it is 75 DIM. The scatter plots show that very few dots fall below these values for the first service for each farm, respectively. This indicates that both farms are demonstrating good compliance with their own voluntary waiting period. Researchers Michael Overton and Victor Cabrera have suggested that a good target for compliance is that less than 3% of cows are bred earlier than the voluntary waiting period.
The evaluation of compliance to the voluntary waiting period is very simple, but selection of the voluntary waiting period within your reproductive plan should warrant careful consideration. According to a recent review article by Ariette van Knegsel, postpartum health, milk yield, lactation persistency, parity and season have all been found to influence the optimal voluntary waiting period.
Step 3: Evaluate the range of DIM at first insemination
Becoming familiar with a few basic patterns makes the interpretation of these graphics most efficient. There are two distinct patterns represented by these example farms. Good compliance to a reproductive plan that targets 100% timed artificial insemination (TAI) produces a “narrow strip” pattern for first service like Farm B in Figure 1. All the dots (services) fall within a narrow range of DIM (75 to 81). According to Mark Doornink, VP of digital technology for Parnell, “The graph of days in milk at first breeding for herds with excellent implementation are often incredibly ‘boring.’ There is only a thin, narrow strip on the graph. That ‘boring’ graph used to mean good repro performance.”
The scatter plot for Farm A looks very different than Farm B, more like a "shotgun blast" than a narrow strip. The plan for Farm A is to begin heat detection and breeding on day 61 and continue through about day 110. Farm A successfully breeds 90% of the cows for the first time within a 43-day window. Therefore this "shotgun blast" appearance of Farm A’s graphic also indicates good compliance to their plan. It is important to note that if Farm B had a plan of 100% TAI but a graph that looked like the shotgun blast of Farm A – this would have indicated poor compliance. So, in this instance, the differences in the graphics for these two herds are due to differences in their reproductive plans, not differences in the execution of their plans.
“In the past, I might have glanced at Farm A and immediately assumed that farm had poor execution of their insemination plan, but that is not the case with Farm A,” Doornink says. "However, both farms are doing well with pregnancy risks greater than 34 percent. While there is always room to improve, these two farms demonstrate that there are multiple ways to achieve good results.”
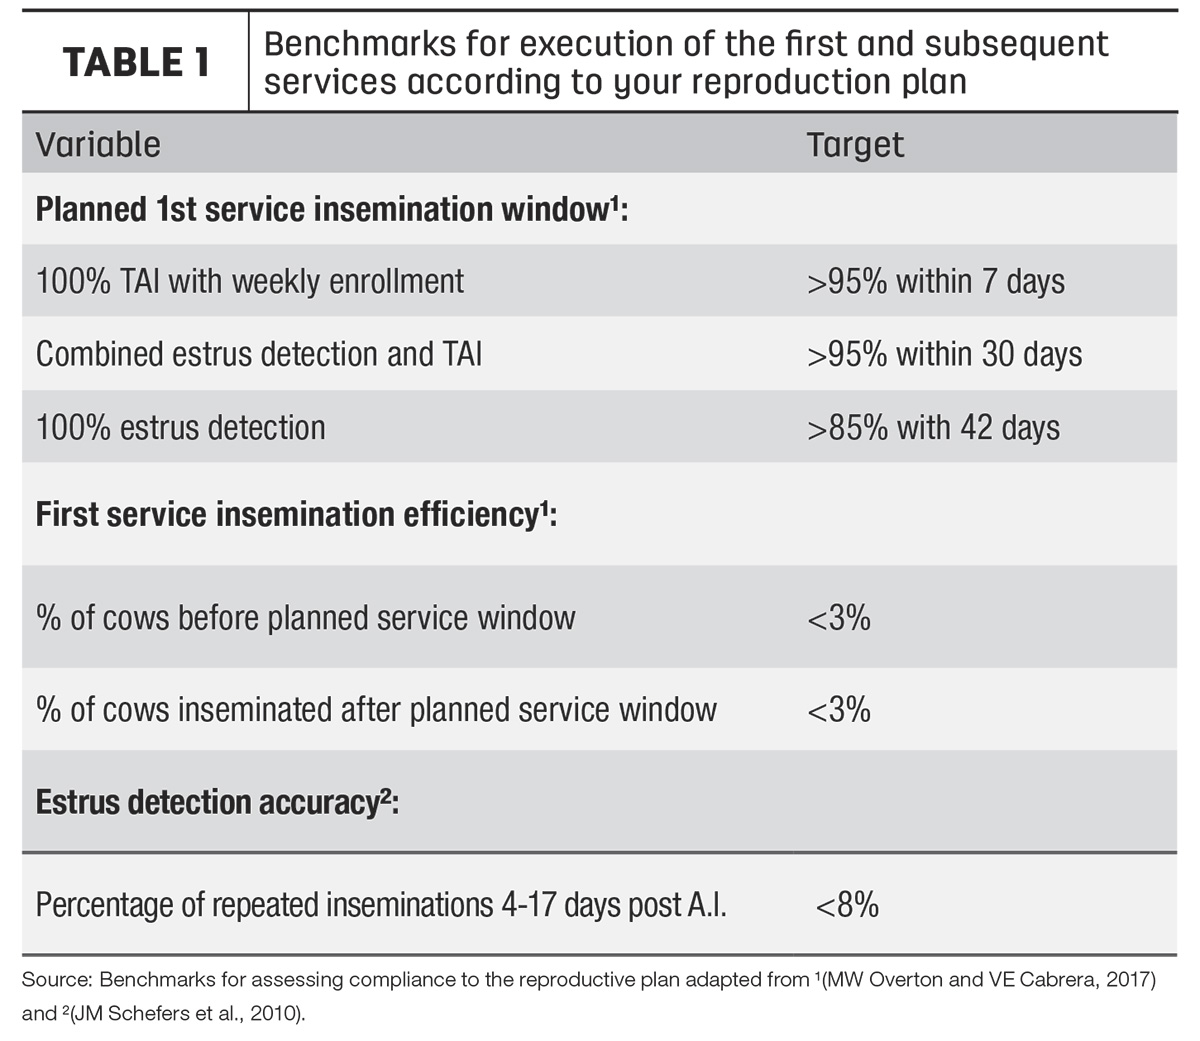
Notice in Table 1 the target values for planned first-service insemination windows depend on the type of reproductive plan.
One thing related to evaluating plan execution, but that does not appear in this particular graphic, is the identification of cows that should have been inseminated but have not been serviced for the first time yet. These cows do not appear on the graphic because they do not have a DIM at the first bred event to plot. Finding these missed cows is an important part of evaluating compliance to an insemination plan.
Step 4: Evaluate the interval between services
Once proper execution of the first service has been achieved, plots can again be utilized to evaluate the intervals between services by graphing both first and second service to visualize the interval (number of days) between these services, which is illustrated in Figure 2.
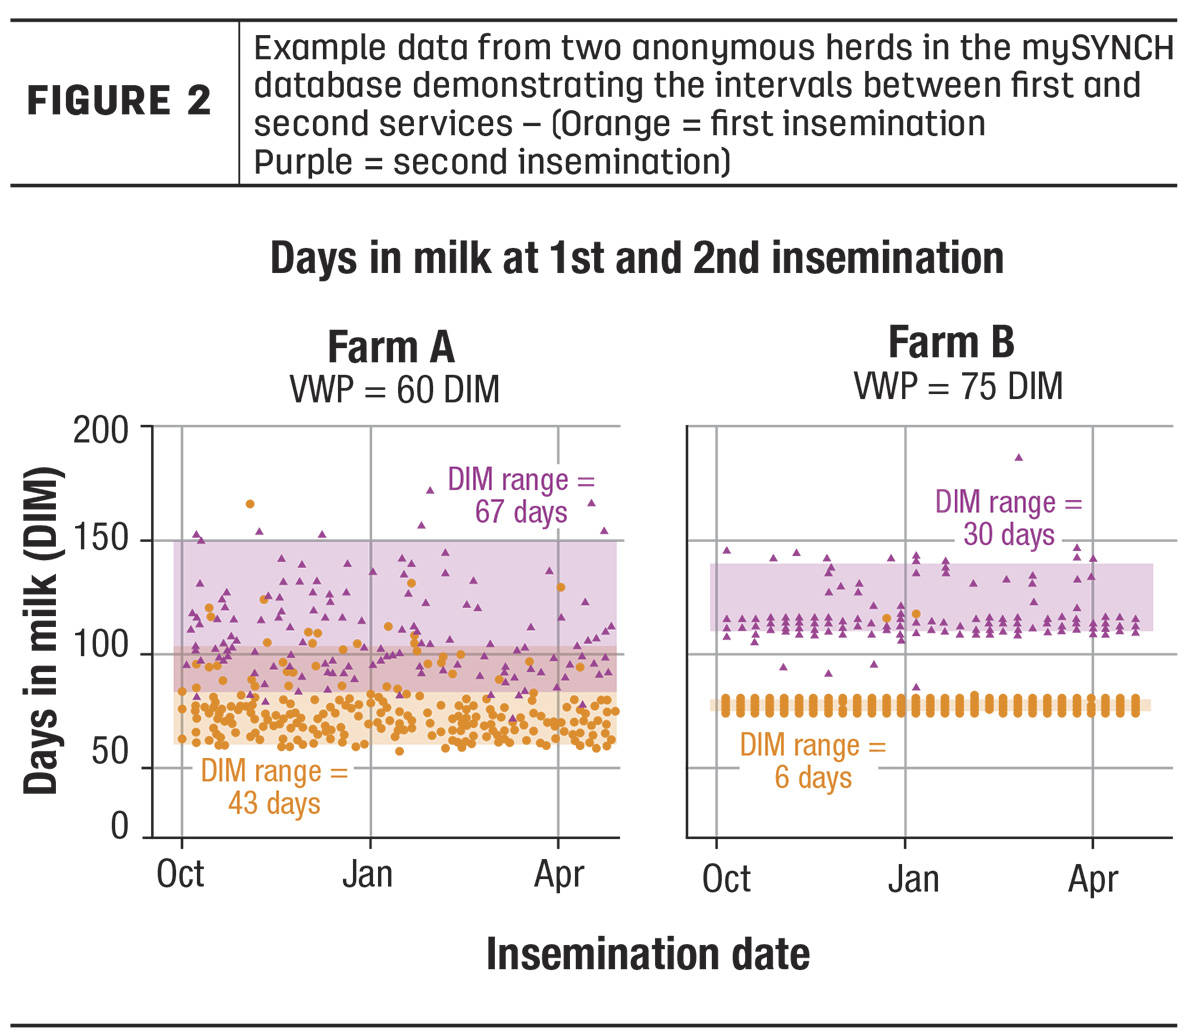
When 100% TAI programs are used, the interval between services is highly dependent on the date of pregnancy detection. When heat detection is utilized, often the interval between services may be shorter than the time required to be able to detect pregnancy. For Farm A, the median of the intervals is 25 days, but for Farm B the median of the intervals is 35 days (Table 2). Again, there are multiple ways to achieve success. For both farms, the most important thing is to identify cows that fall outside the planned insemination interval.
 Reality check
Regardless of your chosen breeding plan, it is important to routinely evaluate whether or not the reality of plan implementation matches the intended plan. Evaluation of DIM at the time of the first and second insemination can be performed immediately after cows are inseminated. If deviations in plan execution are identified, corrective action can be taken weeks before pregnancy detection occurs. This can save you time and improve your reproductive outcomes.
"Don't wait at the end of the pipeline, hoping that the conception rate from the most recent pregnancy check matches expectations," Doornink says. "Move upstream and start with a plan that matches sound science. Follow that up with weekly attention to execution of the plan."