Here’s an update on economic factors impacting your milk check as we kick off September.

- USDA reduces dairy export forecast
- September FSA interest rates steady to higher
- Ag producer sentiment dips
- All-milk, mailbox price spread steady in May
- Canadian cow, heifer numbers down slightly
- Coming up
USDA reduces dairy export forecast
U.S. dairy exports ended the first half of 2023 weaker, and the USDA’s latest quarterly forecast indicates that trend could continue into next year.
Compared to a year earlier, January-June 2023 U.S. dairy export volume fell 5% and value declined 10%, according to the U.S. Dairy Export Council’s U.S. Dairy Exporter Blog. July export data will be released later this week.
Meanwhile, the latest USDA quarterly Outlook for U.S. Agricultural Trade report, released Aug. 31, forecasts the value of U.S. dairy exports at about $8.6 billion in fiscal year (FY) 2023 (Oct. 1, 2022-Sept. 30, 2023). That’s down $300 million from the $8.9 billion projected last May and below the nearly $9.1 billion in dairy product values exported in FY 2022. The decrease from last May’s outlook is attributed to lower shipments of whey and cheese to key markets in Southeast Asia.
FY 2023 U.S. dairy imports are forecast at $5.2 billion, up $100 million from May’s forecast and up more than $600 million from the FY 2022 total of $4.6 billion, based on stronger shipments of infant formula and butterfat products from the European Union. FY 2023 cheese imports are expected to hit $1.7 billion, $100 million less than the previous forecast but up $170 million from FY 2022’s total.
In the first forecast for FY 2024 (Oct. 1, 2023-Sept. 30, 2024), USDA estimated dairy exports will fall to $7.4 billion due to declines in global export prices of key products. Dairy imports are forecast to hit $5.3 billion, with cheese imports higher at $1.8 billion.
Despite the downturn in trade balance, the dairy category remains a positive compared to other agricultural products. The USDA’s August forecast estimated FY 2023 agricultural exports at $177.5 billion, down about $3.5 billion from the May outlook. FY 2023 imports were forecast at $199.5 billion, yielding an ag trade deficit of $19 billion.
The USDA’s August forecast estimated FY 2024 agricultural exports at $172 billion, down about $5.5 billion from FY 2023. U.S. agricultural imports in FY 2024 are forecast at $199.5 billion, $3 billion higher than the revised FY 2023 estimate. That would yield an ag trade deficit of $27.5 billion.
The U.S. had small ag trade balances in FY 2021-22, but negative agricultural trade balances in 2019-20.
September FSA interest rates steady to higher
Private-lender interest rates on agricultural loans are moving higher and so are rates on operating loans through the USDA’s Farm Service Agency (FSA). September 2023 interest rates for FSA operating and ownership loans (compared to August) are as follows:
- Farm operating loans (direct): 5.125%, up from 4.875%
- Farm ownership loans (direct): 5%, unchanged
- Farm ownership loans (direct, joint financing): 3%, unchanged
- Farm ownership loans (down payment): 1.5%, unchanged
- Emergency Loan (amount of actual loss): 3.75%, unchanged
The FSA also offers guaranteed loans through commercial lenders at rates set by those lenders.
Additionally, the FSA provides low-interest financing to producers to build or upgrade on-farm storage facilities and purchase handling equipment and loans that provide interim financing to help producers meet cash flow needs without having to sell their commodities when market prices are low. Funds for these loans are provided through the Commodity Credit Corporation (CCC) and are administered by the FSA.
- Commodity loans (less than one year disbursed): 6.375%, unchanged from August
- Farm storage facility loans: Three-year loan terms – 4.5%, up from 4.375%; five-year loan terms – 4.25%, up from 4.125%; seven-year loan terms – 4.125%, up from 4%; 10-year loan terms – 4.125%, up from 3.875%; and 12-year loan terms – 4.125%, up from 3.875%.
For more information, producers can contact their local USDA Service Center.
Ag producer sentiment dips
Short- and long-term economic outlooks of more agricultural producers dipped in August, according to the latest Purdue University/CME Group Ag Economy Barometer.
"Rising interest rates and concerns about high input prices continue to put downward pressure on producer sentiment," said James Mintert, the barometer's principal investigator and director of Purdue University's Center for Commercial Agriculture.
The Ag Economy Barometer provides a monthly snapshot of farmer sentiment regarding the state of the agricultural economy. The survey collects responses from 400 producers whose annual market value of production is equal to or exceeds $500,000. Minimum targets by enterprise are as follows: 53% corn/soybeans, 14% wheat, 3% cotton, 19% beef cattle, 5% dairy and 6% hogs. Latest survey results, released Sept. 5, reflect ag producer outlooks as of Aug. 14-18.
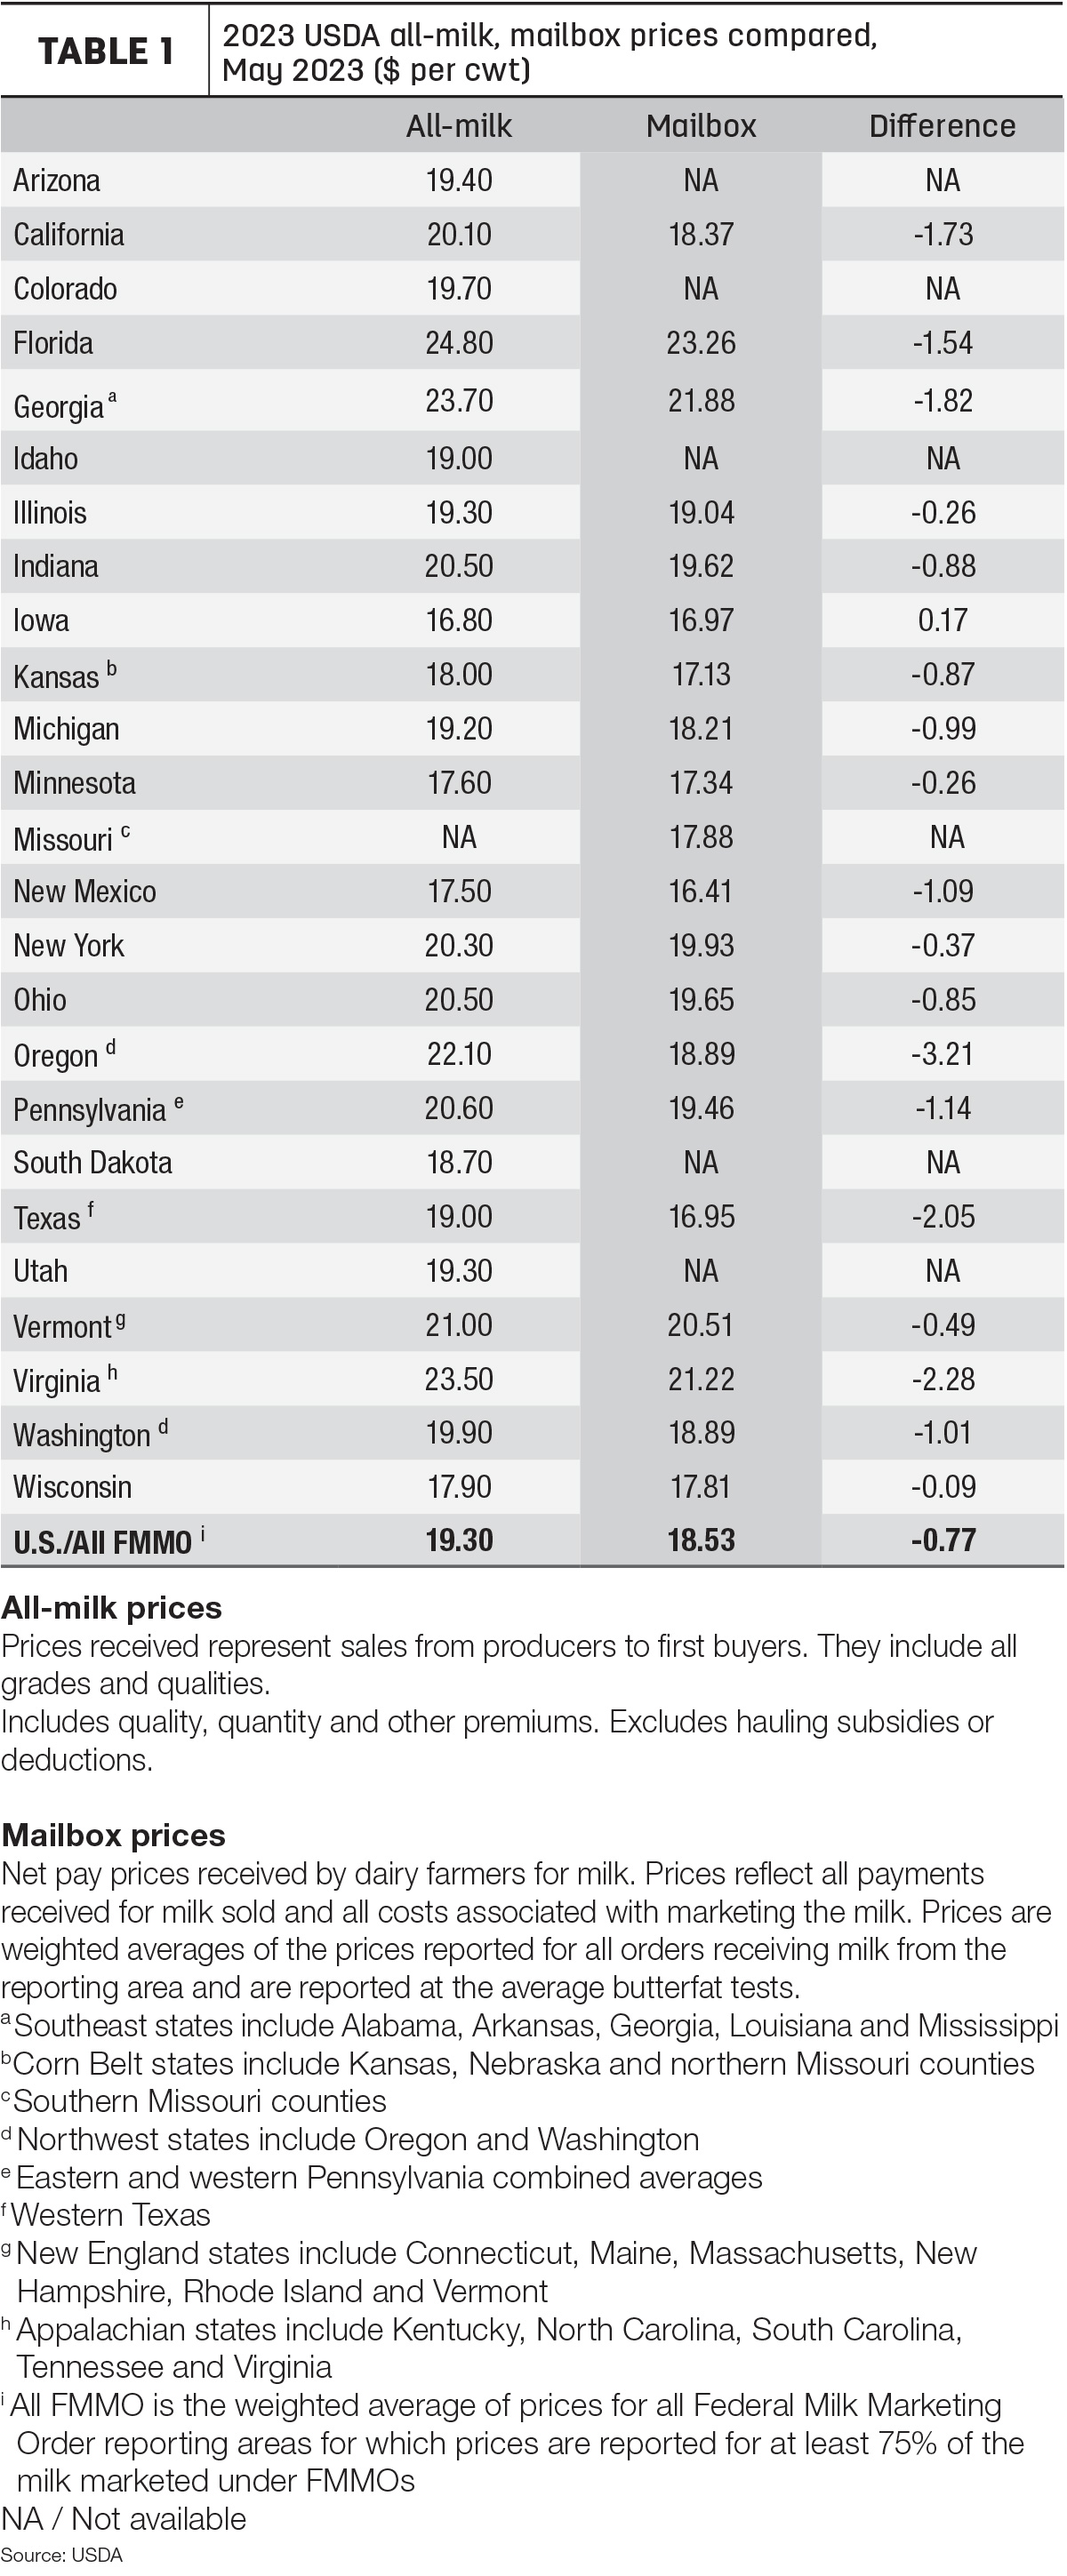
All-milk, mailbox price spread steady in May
May 2023 “mailbox” prices averaged about 77 cents per hundredweight (cwt) less than announced average “all-milk” prices for the same month, based on a preliminary look at two USDA milk price announcements.
- May U.S. all-milk prices averaged $19.30 per cwt, down $1.40 from April 2023.
All-milk prices are reported monthly by the USDA National Ag Statistics Service (NASS). The all-milk price is the estimated gross milk price received by dairy producers for all grades and qualities of milk sold to first buyers, before marketing costs and other deductions. The price includes quality, quantity and other premiums, but hauling subsidies are excluded.
- The May 2023 mailbox prices for selected Federal Milk Marketing Orders (FMMOs) averaged $18.53 per cwt, down $1.38 per cwt from April.
The mailbox price is the estimated net price received by producers for milk, including all payments received for milk sold and deducting costs associated with marketing. Mailbox prices are reported monthly by the USDA’s Agricultural Marketing Service (AMS) and generally lag all-milk price announcements by a month or more.
As Progressive Dairy notes each month, there’s a disclaimer of sorts. Comparing the all-milk price and mailbox price isn’t exactly apples to apples. The price announcements reflect similar – but not exactly the same – geographic areas. In Table 1, Progressive Dairy attempts to align the state-level all-milk prices and the FMMO marketing area prices as closely as possible. The May spread between individual states or regions varied widely.
The difference in the two announced prices can affect dairy risk management, since indemnity payments under the Dairy Margin Coverage (DMC) are based on the all-milk price, while Dairy Revenue Protection (Dairy-RP) and Livestock Gross Margin for Dairy (LGM-Dairy) programs are based on FMMO class and component prices.
Canadian cow, heifer numbers down slightly
As of July 1, 2023, there were 969,400 dairy cows in Canada, down about 5,200 head from the year before, according to data compiled by the USDA and Statistics Canada.
The report also estimated there were 412,500 dairy heifers aged 1 year or older, down about 7,500 from a year earlier.
The 2023 Canadian total would be equal to the combined dairy herds of Iowa, Pennsylvania and Washington in the U.S.
Previously, the USDA National Ag Statistics Service estimated the number of dairy cows calving in the past year in the U.S. at 9.4 million head, unchanged from July 1, 2022. Dairy replacement heifers weighing more than 500 pounds were estimated at 3.65 million, down 100,000 head from a year earlier.
Coming up
Additional dairy economic reports coming up at Progressive Dairy’s deadline:
- U.S. July 2023 dairy and other agricultural products export estimates will be released Sept. 7.
- The USDA’s monthly World Ag Supply and Demand Estimates report (WASDE) report is released Sept. 12, providing updated milk and dairy feedstuff production and price projections for 2023-24.
- Administrators of the 11 FMMOs will report August 2023 prices and pooling data, Sept. 11-14.

