
Based on new data from the USDA Economic Research Service (ERS), increased consumption of cheese helped offset another year-to-year decline in fluid beverage milk.

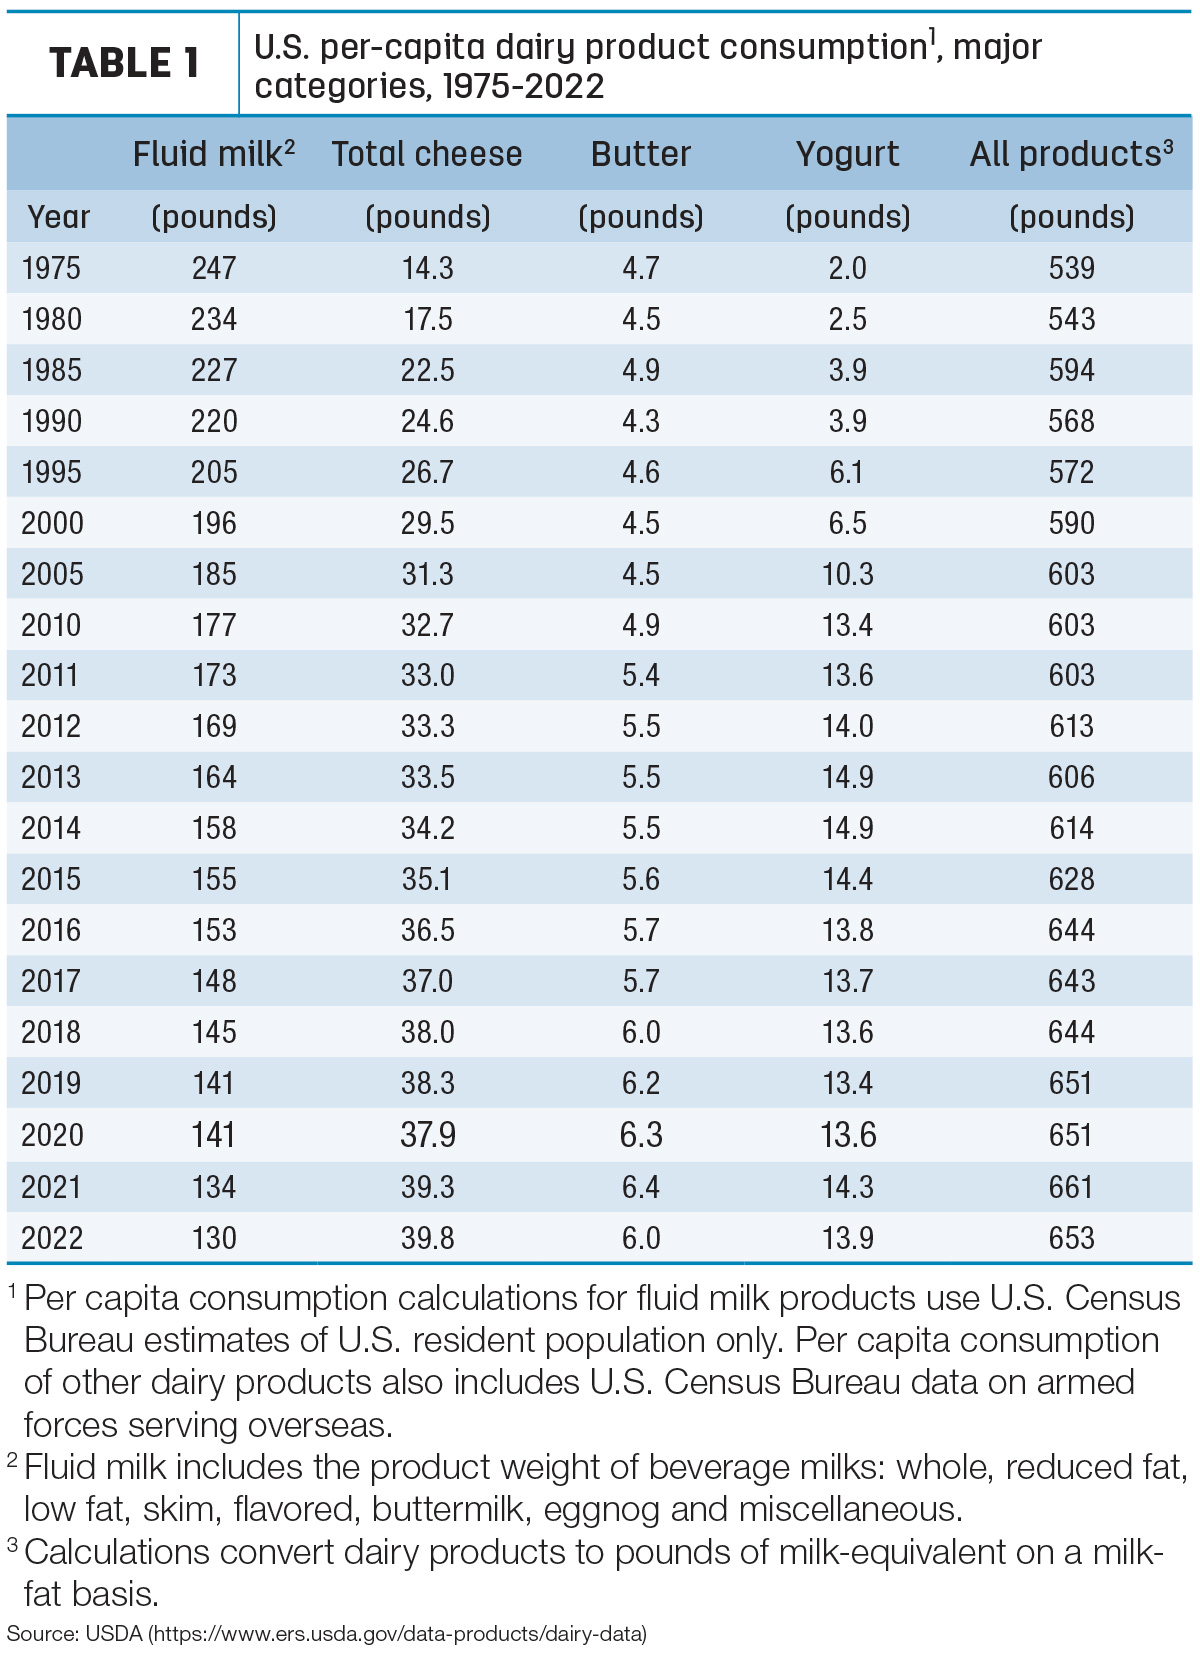
Annual data from USDA ERS, which began tracking annual consumption of dairy products in 1975, shows U.S. per-capita consumption of dairy products (on a milk equivalent, milkfat basis) decreased 8 pounds from 2021, to 653 pounds in 2022 (Table 1).
It was the first year-to-year decrease since 2017, with inflation likely a contributing factor. U.S. Department of Labor Consumer Price Index data shows the cost of dairy products purchased for home consumption in 2022 rose about 12% from 2021. Additionally, 2021 per-capita consumption was boosted by dairy donations to COVID-related federal feeding programs.
Per-capita dairy product consumption has risen 10 pounds in the past five years, from 643 pounds in 2017, and was up 85 pounds since 1990.
U.S. consumers continue to eat more dairy in the form of cheese, while butter and yogurt decreased. The long-term decline in the consumption of fluid milk persists (Table 1).
Cheese consumption sets record
Cheese consumption set an all-time high in 2022 to reach nearly 40 pounds per person, a half-a-pound per-person increase over the previous year. For comparison, the average American consumed 32.2 pounds of cheese in 2000 and 21.9 pounds in 1980.
Consumption for American-type cheeses stayed the same at about 16.2 pounds per capita in 2022, with a small decrease in cheddar offset by a slight increase in other cheeses. Consumption of Italian-type cheeses also increased slightly, to 16.14 pounds per person. It marked the third straight year that per-capita consumption of American cheeses surpassed Italian cheeses, reversing a decade-long period in which those categories were flipped.
Consumption of Swiss, blue, Muenster, cream/Neufchatel and Hispanic cheeses were all steady or slightly higher than the year before. Cottage cheese consumption remained the same as last year at just below 2 pounds per person for the second year in a row, according to USDA records.
Consumption of processed cheese and cheese foods and spreads added another 8.25 pounds, which remained the same from last year and is still the highest total since 1999.
Butter, yogurt consumption decreases
After five years of increases, per-capita consumption of butter fell 0.4 pound in 2022 to 6 pounds. After posting declines for most of the last quarter of the 1900s, annual per-capita butter consumption has now increased 1.5 pounds since 2000.
The consumption of yogurt (other than frozen) decreased in 2022 to 13.9 pounds per capita, down 0.4 pound from the previous year. It remains 1 pound less than the peak in 2013-14.
Per-capita consumption of other dairy products was mixed. Americans indulged in more regular ice cream and less low-fat and nonfat ice cream (about 18.9 pounds), as well as increased frozen yogurt intake and decreased sherbet. Consumption of dry products (milk and whey powders) was mostly unchanged from 2021.
Fluid milk continues slide
U.S. per-capita consumption of fluid milk was estimated at 130 pounds in 2022, down another 4 pounds from 2021 (Table 2). Longer-term, per-capita fluid consumption was down 66 pounds (roughly 7.7 gallons) since 2000.
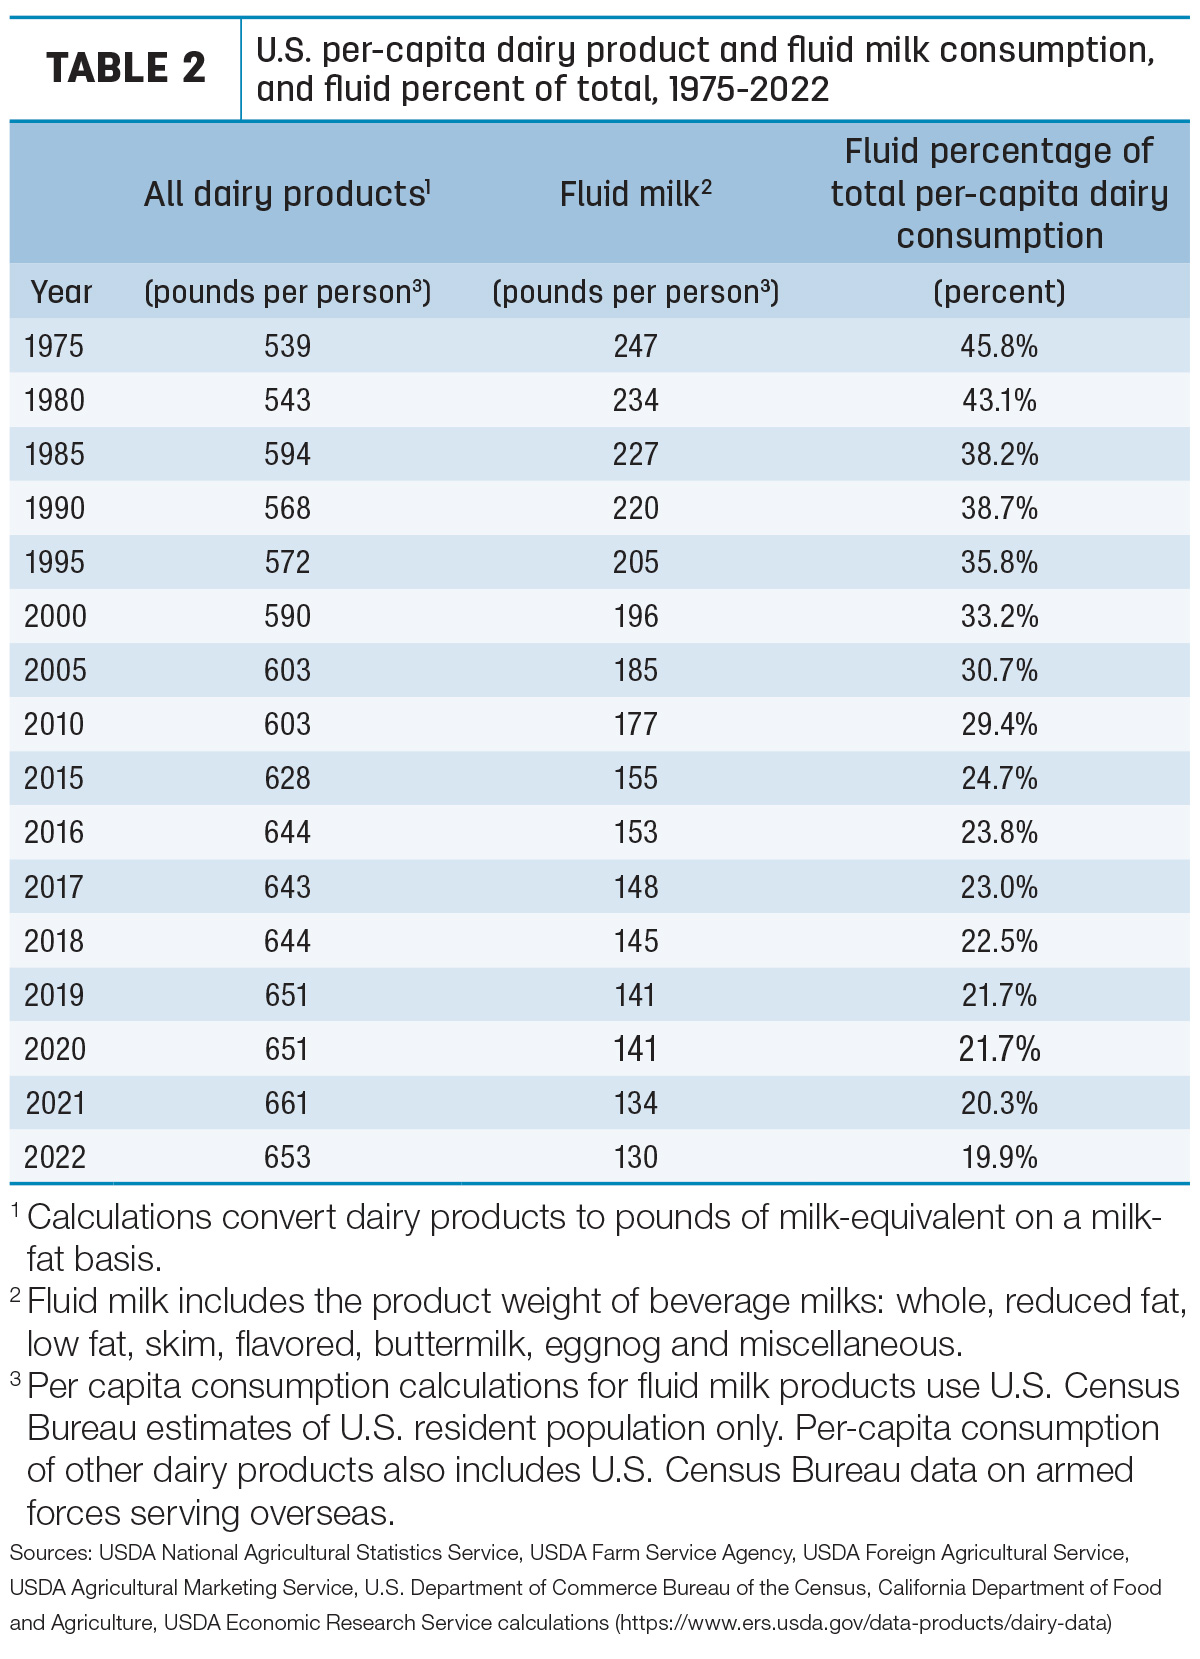
As a percentage of total U.S. dairy product consumption, fluid beverage milk slipped from nearly 46% in 1975 to about 20% in 2022.
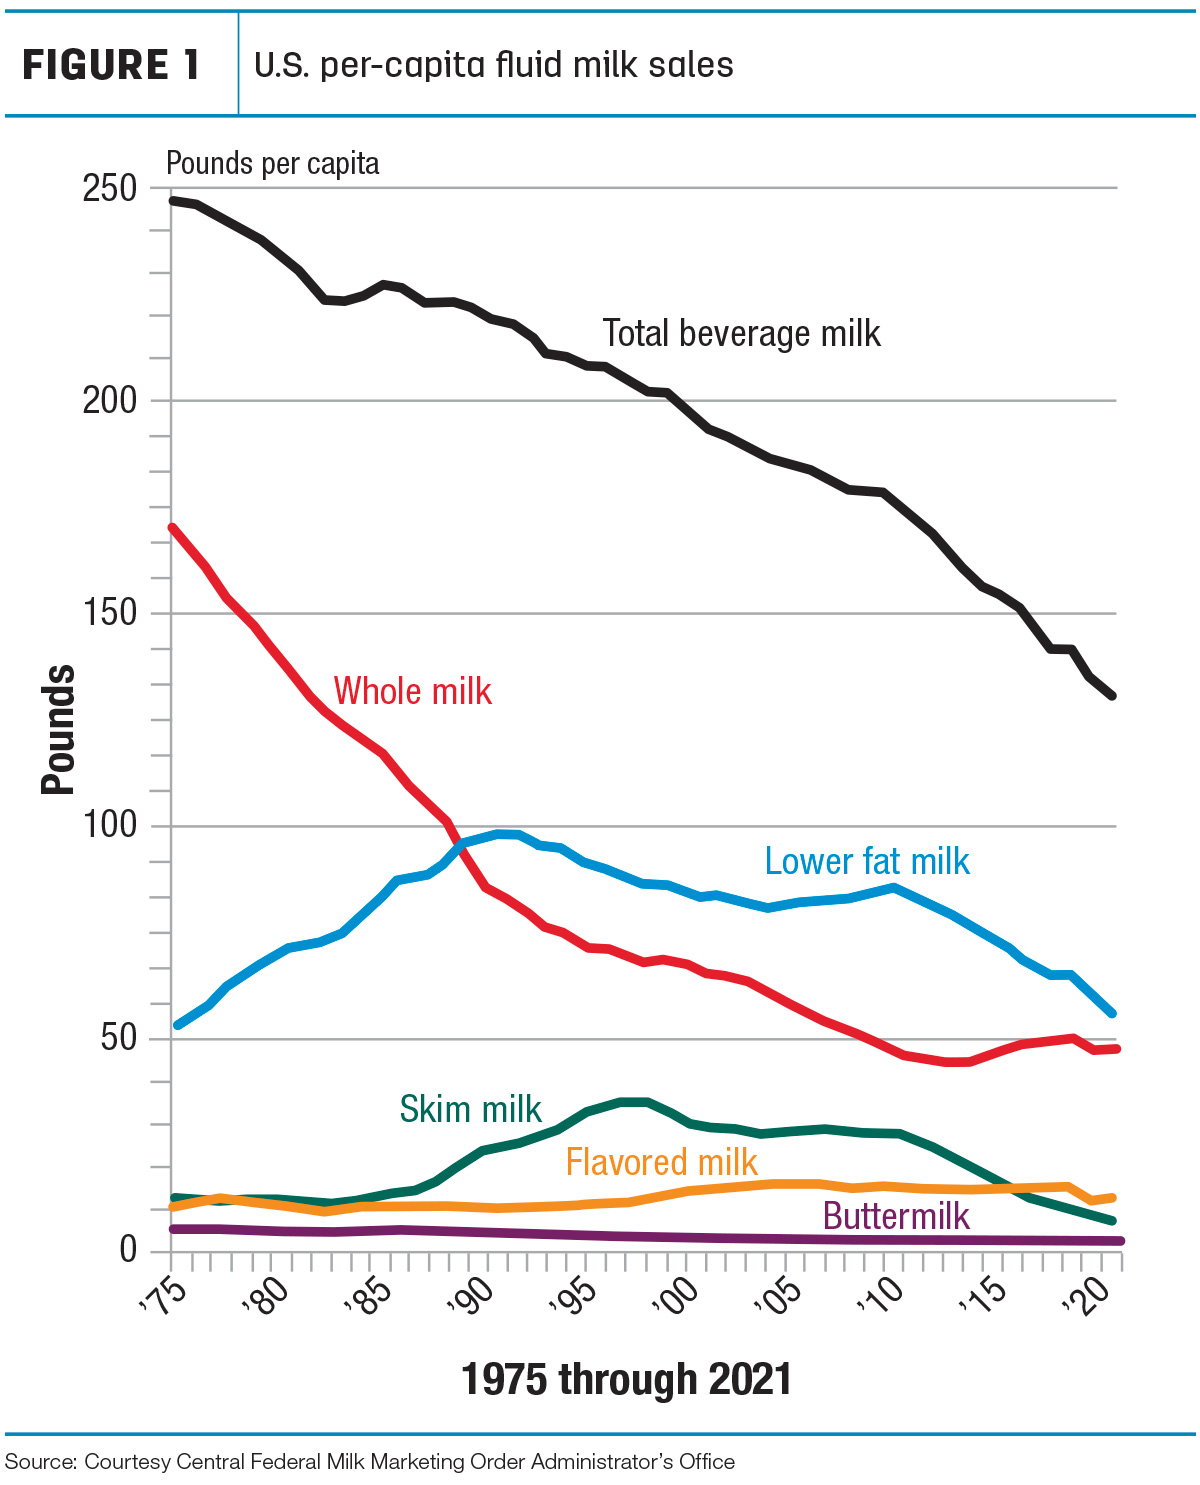
U.S. consumers reversed last year’s trend in which sales of whole milk increased from the previous year (Figure 1). Total U.S. sales of whole milk rose to 16 billion pounds, up 207 million pounds from 2021. Sales of reduced-fat (2%), low-fat (1%) and skim milk also declined a combined 1.42 billion pounds. Flavored whole milk, buttermilk and eggnog also slightly fell. Those declines were only partially offset by increased sales of flavored milk other than whole. All told, fluid product sales were down 1.07 billion pounds from 2021.
Organic milk represented about 6.6% of all fluid milk product sales in 2022, up from about 6.3% in 2021.
Serving the fluid market, the number of fluid processing plants in the U.S. decreased in 2022 to 463.
“Americans are turning to dairy like never before as part of their health regimen, to celebrate with family and friends, or to liven up their meal and snacking routines,” said Michael Dykes, president and CEO of the International Dairy Foods Association. “The data from USDA demonstrate how consumers continue to choose dairy products even as they exercise cost-conscious shopping, illustrating how dairy remains affordable and accessible to all people. Dairy is more than a food or beverage – it has become an essential part of our lives, in more than 95% of U.S. households on any given day. The growth in dairy consumption is a testament to America’s dairy foods makers who offer wholesome, delicious, affordable products for people all ages, all year around.”
“If it’s made with dairy and it can fit on a plate, in a bowl or in your favorite mug, chances are Americans are loving it more than ever before. Today’s dairy is different because dairy is always evolving to give Americans what they crave,” he concluded.


